2021-22 Work health and safety statistics - Construction
Key injury claims information
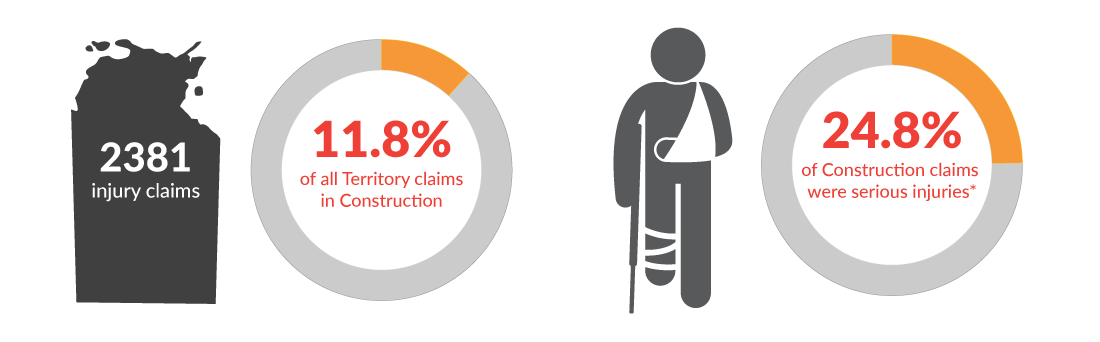
 * Claims where the worker needed at least one week of due to their injuries are considered serious injuries.
Injury claims by age and gender

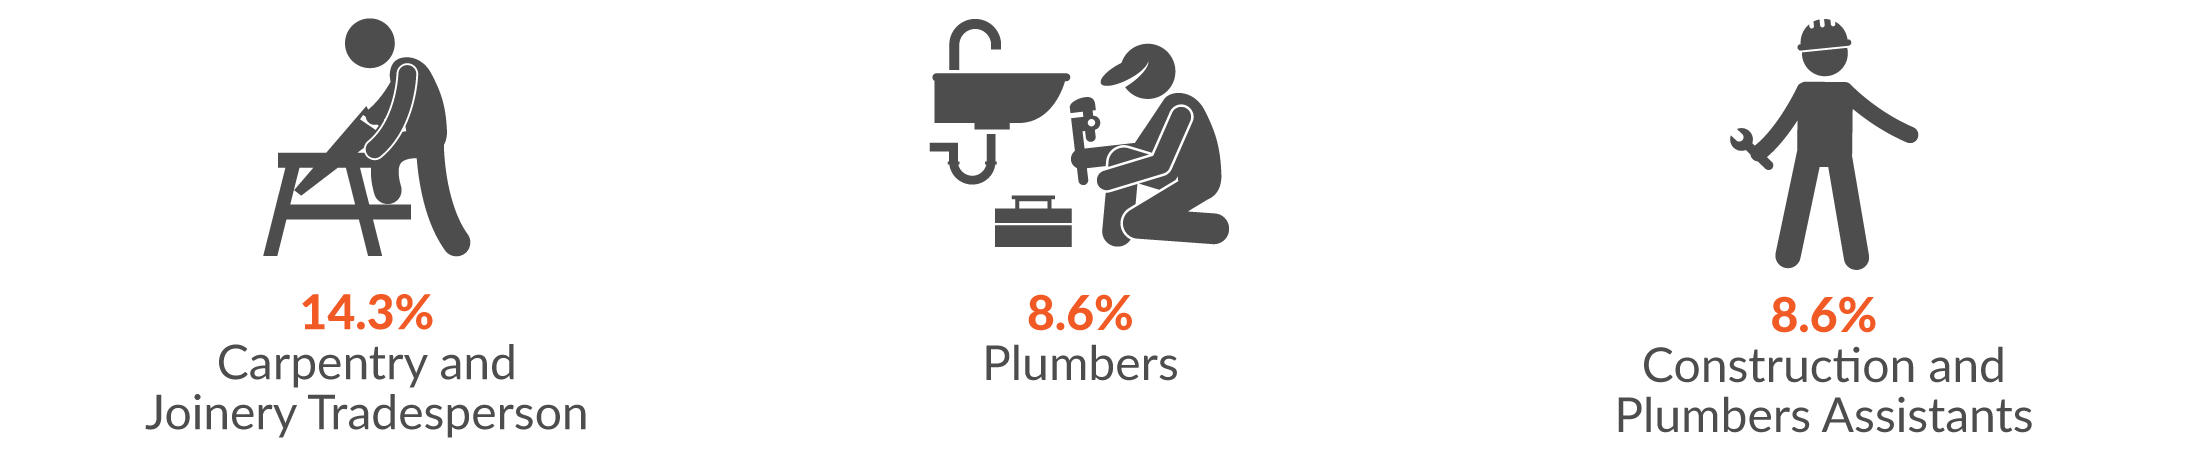
Main occupations seriously injured
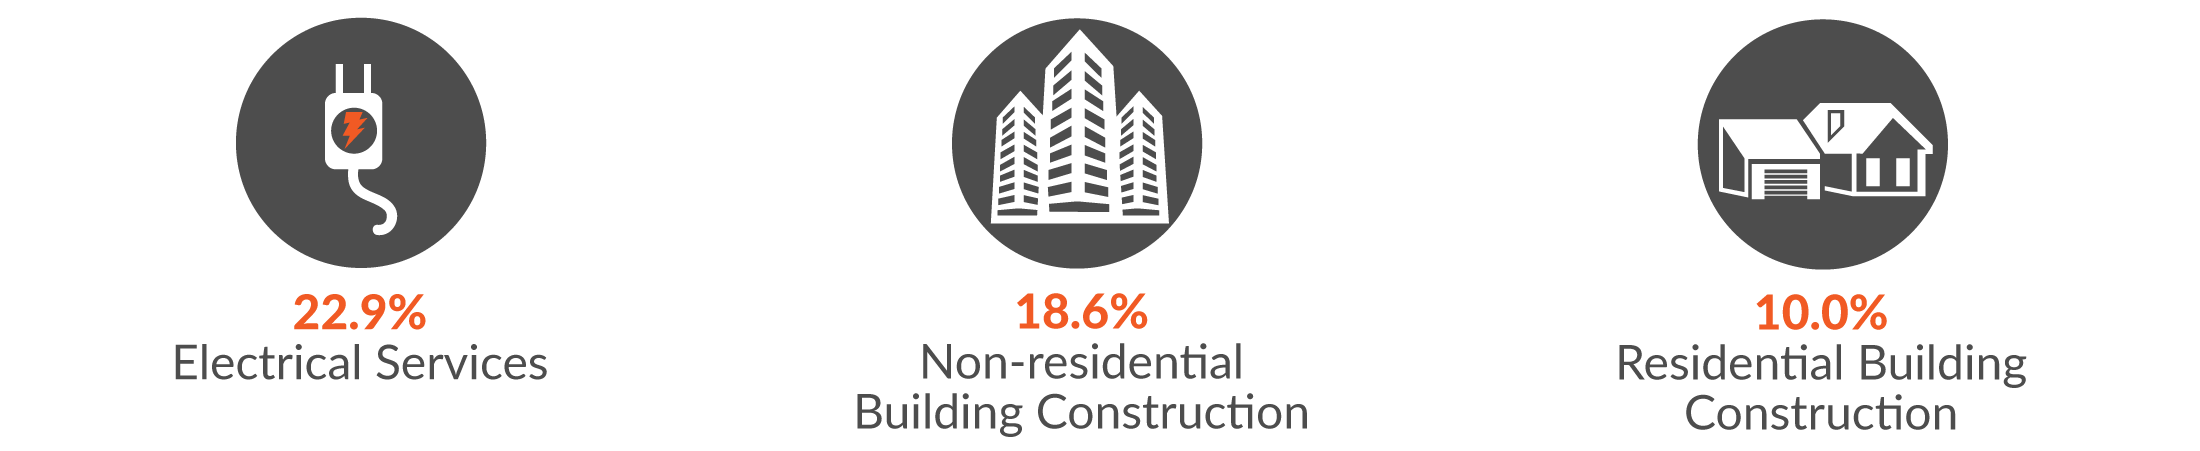
Main industry sub-groups by serious injury claims
Main mechanisms of serious injury
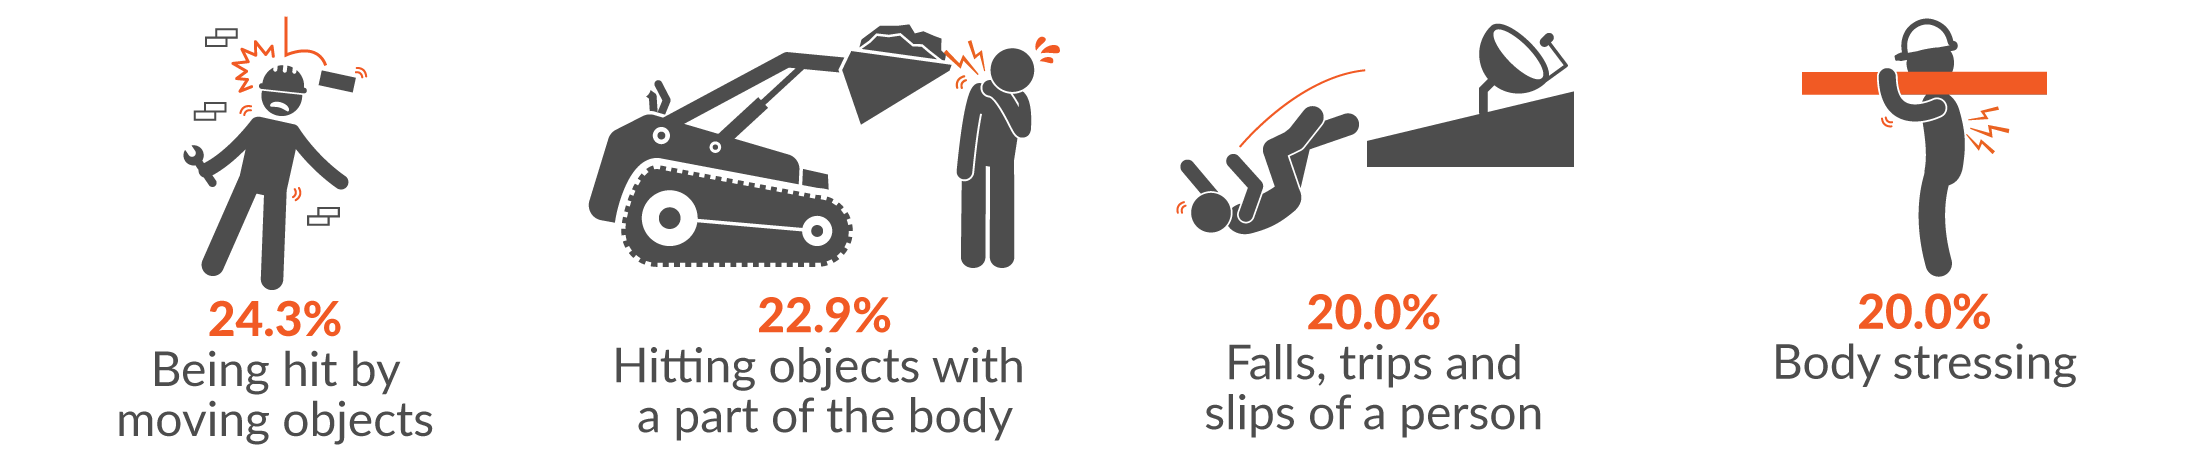
Break down by main mechanisms of serious injury
-
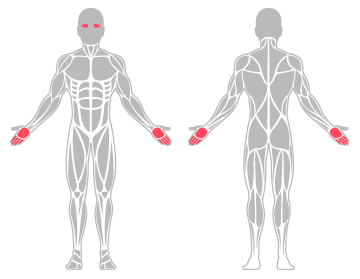
Being hit by moving objects
The main three injury groups resulting from being hit by moving objects were:
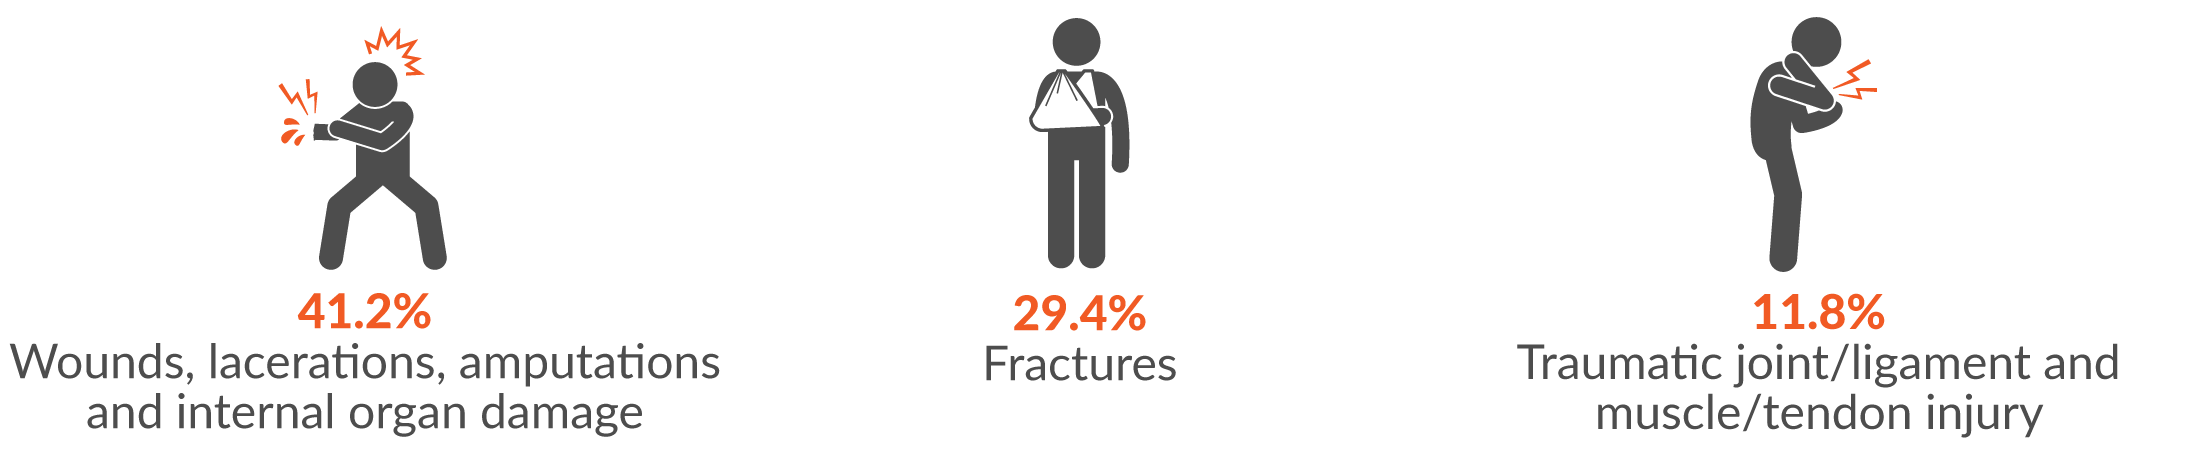
The three main incident types were:
- Being hit by moving object (41.2%)
- Being hit by falling object (29.4%)
- Being trapped between stationary and moving object (17.6%)
Main body areas injured were:
- Fingers (41.2%)
- Eye (unspecified) (11.8%)
- Hand (11.8%)
-
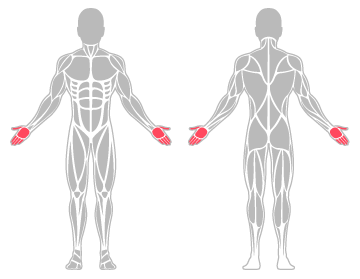
Hitting objects with a part of the body
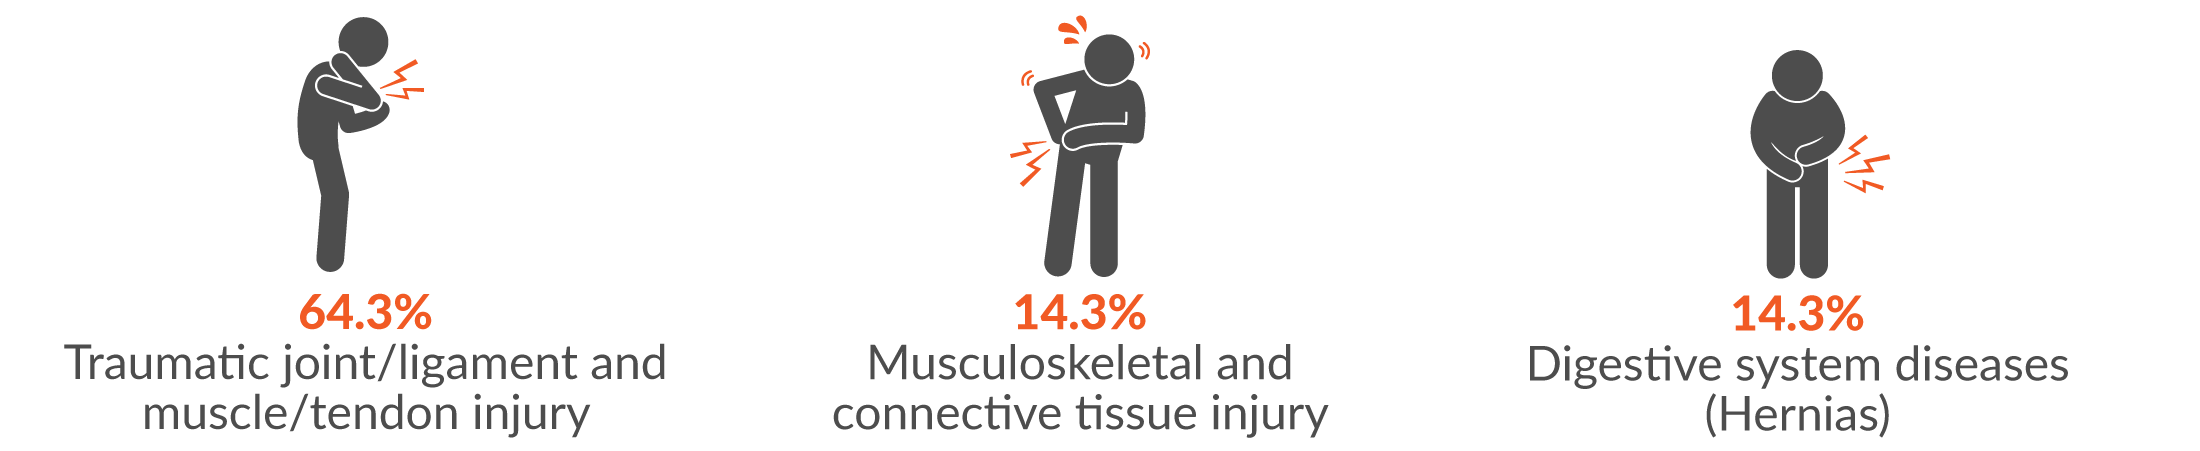
The main three injury groups resulting from hitting objects with a part of the body were:
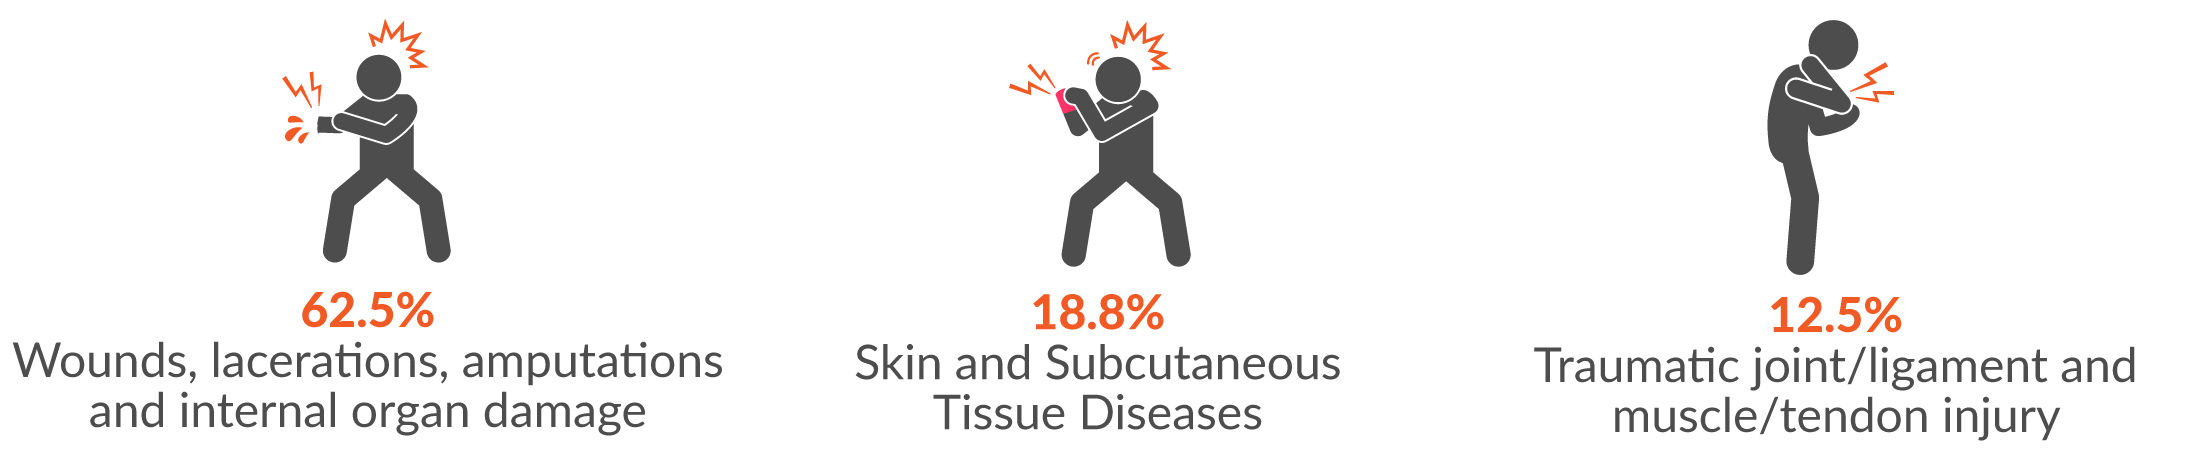
The two main incident types were:
- Hitting moving objects (56.3%)
- Hitting stationary objects (37.5%)
Main body areas injured were:
- Fingers (31.3%)
- Thumb (25.0%)
- Hand (25.0%)
-
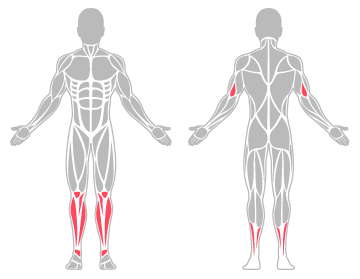
Falls, trips and slips of a person
The main two injury groups resulting from falls, trips and slips of a person were:

The two main incident types were:
- Falls from a height (71.4%)
- Falls on the same level (28.6%)
The main body areas injured were:
- Knee (21.4%)
- Ankle (21.4%)
- Lower leg (14.3%)
- Elbow (14.3%)
-
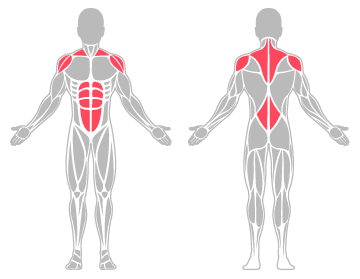
Body stressing
The main three injury groups resulting from body stressing were:
The two main incident types were:
- Muscular stress while lifting, carrying, or putting
down objects (71.4%) - Muscular stress while handling objects other than
“lifting, carrying or putting down (21.4%)
The main body areas injured were:
- Lower back (42.9%)
- Abdominal muscles and tendons (21.4%)
- Shoulder (14.3%)
- Muscular stress while lifting, carrying, or putting
← Government administration and defence 21-22
Accommodation, cafes and restaurants 21-22 →