2022-23 Key NT work health and safety statistics

Key injury claims information

This infographic shows there were a total of 2337 workers compensation claims in the Northern Territory for the year 2021-23. 19.2% of all Territory claims were for serious injuries. 86.1% of all Territory workers compensation claims were accepted by the insurer (as at 19 July 2023).

This infographic shows the total workers compensation claims resulted in 3313 total lost time in weeks and $38,558,147 was paid in benefits.

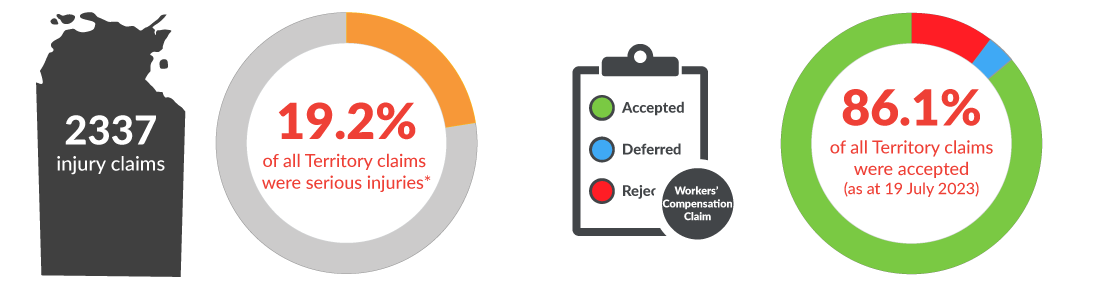
* Claims where the worker needed at least one week of due to their injuries are considered serious injuries.

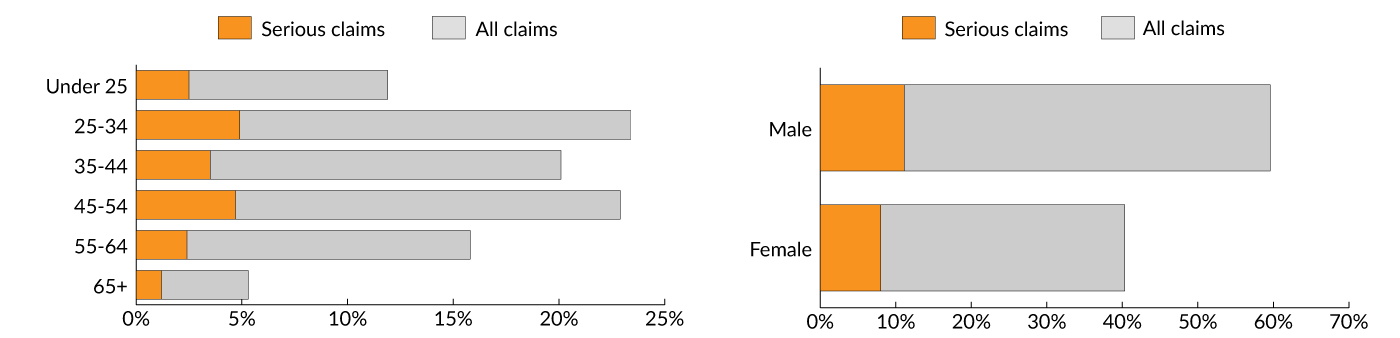
Injury claims by age and gender

The image shows two bar graphs detailing injury claims by age and gender. In the age graph, 12.5% of injuries occurred in workers under 25, and 20.3% of injured workers in that age bracket were seriously injured. 23.4% of injuries occurred in the 25 to 34 age bracket, and 21.0% of injured workers in that age bracket were seriously injured. 20.2% of injuries occurred in the 35 to 44 age bracket, and 17.4% of injured workers in that age bracket were seriously injured. 22.9% of injuries occurred in the 45 to 54 age bracket, and 20.4% of injured workers in that age bracket were seriously injured. 15.7% of injuries occurred in the 55 to 64 age bracket, and 14.9% of injured workers in that age bracket were seriously injured. 5.3% of injuries occurred in the 65+ age bracket, and 22.6% of injured workers in that age bracket were seriously injured. In the gender graph, 59.6% of injured workers were male, with 18.7% seriously injured, and 40.4% of injured workers were female, with 19.9% seriously injured.

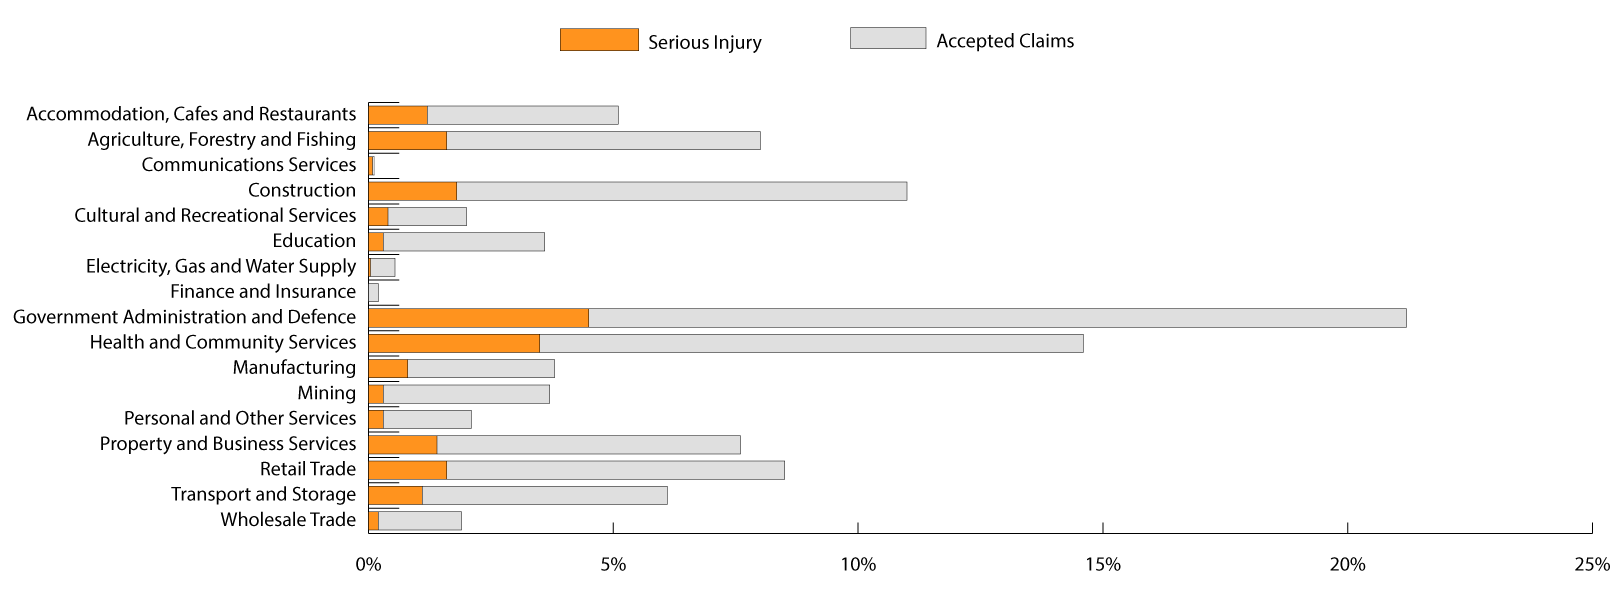
Injury claims by all industries

This bar graph shows the breakdown of workers compensation claims by Industry Groups. Accommodation, cafes and restaurants accounted for 5.1% of all Territory workers compensation claims, with 24.2% of those claims for a serious injury. Agriculture forestry & fishing accounted for 8.0% of all Territory workers compensation claims, with 19.8% of those claims for a serious injury. Communications services accounted for 0.1% of all Territory workers compensation claims, with 66.7% serious injury claims. Construction accounted for 11.0% of all Territory workers compensation claims, with 16.3% of those claims for a serious injury. Cultural and recreational services accounted for 2.0% of all Territory workers compensation claims, with 19.1% of those claims for a serious injury. Education accounted for 3.5% of all Territory workers compensation claims, with 7.3% of those claims for a serious injury. Electricity, gas and water supply accounted for 0.5% of all Territory workers compensation claims, with 8.3% of those claims for a serious injury. Finance and insurance accounted for 0.2% of all Territory workers compensation claims, with no serious injury claims. Government administration and defence accounted for 21.1% of all Territory workers compensation claims, with 21.1% of those claims for a serious injury. Health and community services accounted for 14.6% of all Territory workers compensation claims, with 24.0% of those claims for a serious injury. Manufacturing accounted for 3.8% of all Territory workers compensation claims, with 20.5% of those claims for a serious injury. Mining accounted for 3.7% of all Territory workers compensation claims, with 9.2% of those claims for a serious injury. Personal and other services accounted for 2.1% of all Territory workers compensation claims, with 16.3% of those claims for a serious injury. Property and business services accounted for 7.6% of all Territory workers compensation claims, with 18.5% of those claims for a serious injury. Retail trade accounted for 8.6% of all Territory workers compensation claims, with 19% of those claims for a serious injury. Transport and storage accounted for 6.1% of all Territory workers compensation claims, with 18.3% of those claims for a serious injury. Wholesale trade accounted for 1.9% of all Territory workers compensation claims, with 11.4% of those claims for a serious injury.

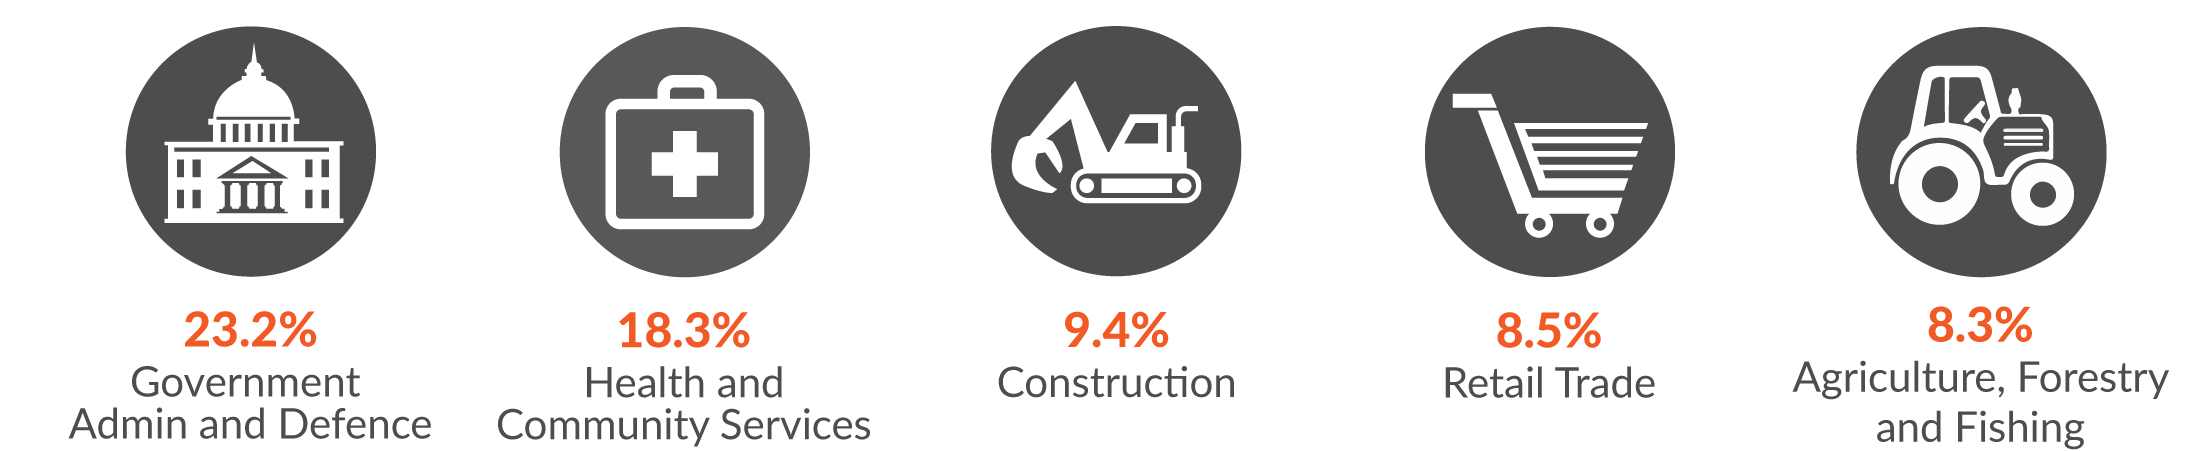
Main industries by serious injury

This infographic shows the top five industries with the highest proportion of serious injury claims. 23.2% of all serious claims were made in Government Administration and Defence. 18.3% of all serious claims were made in Health and Community Services. 9.4% of all serious claims were made in Construction. 8.5% of all serious claims were made in Retail trade. Lastly, 8.3% of all serious claims were made in Agriculture, Forestry and Fishing.

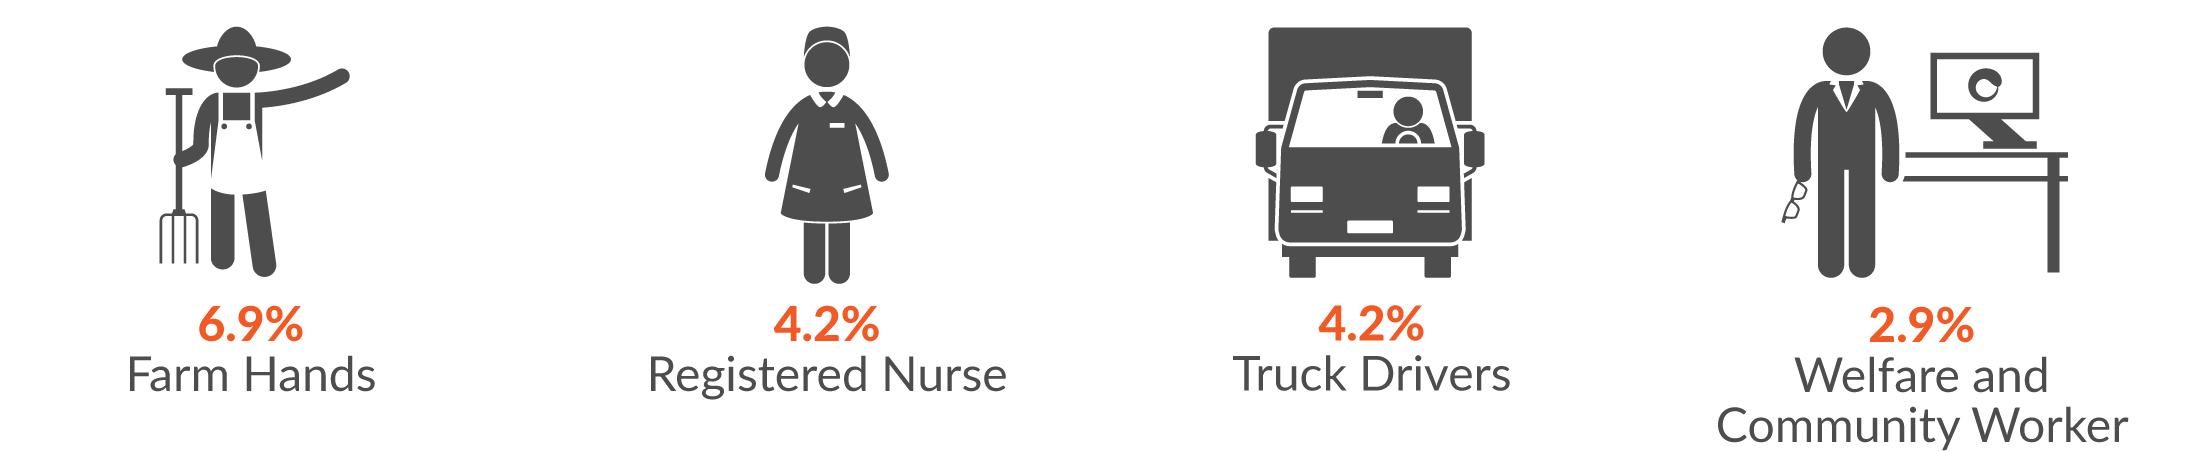
Main occupations seriously injured

This infographic shows the main occupations by serious injury claims. 6.9% of all Territory serious injury claims were made by farm hands, followed by 4.2% by registered nurse and truck drivers (also 4.2%), and 2.9% by welfare and community worker.

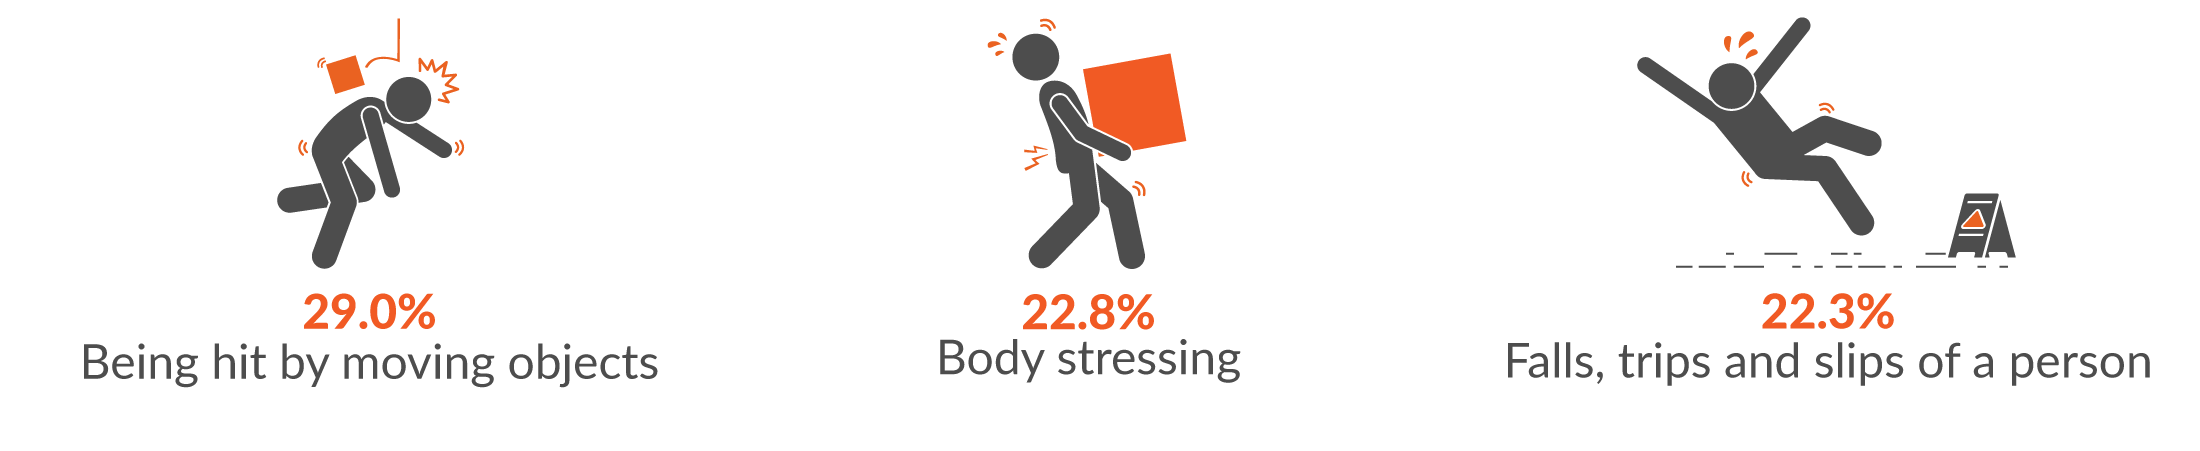
Main mechanisms of serious injury

This infographic shows the main three mechanisms for serious injuries were 29.0% being hit by moving objects; 22.8% body stressing; and 22.3% falls, trips and slips of a person.

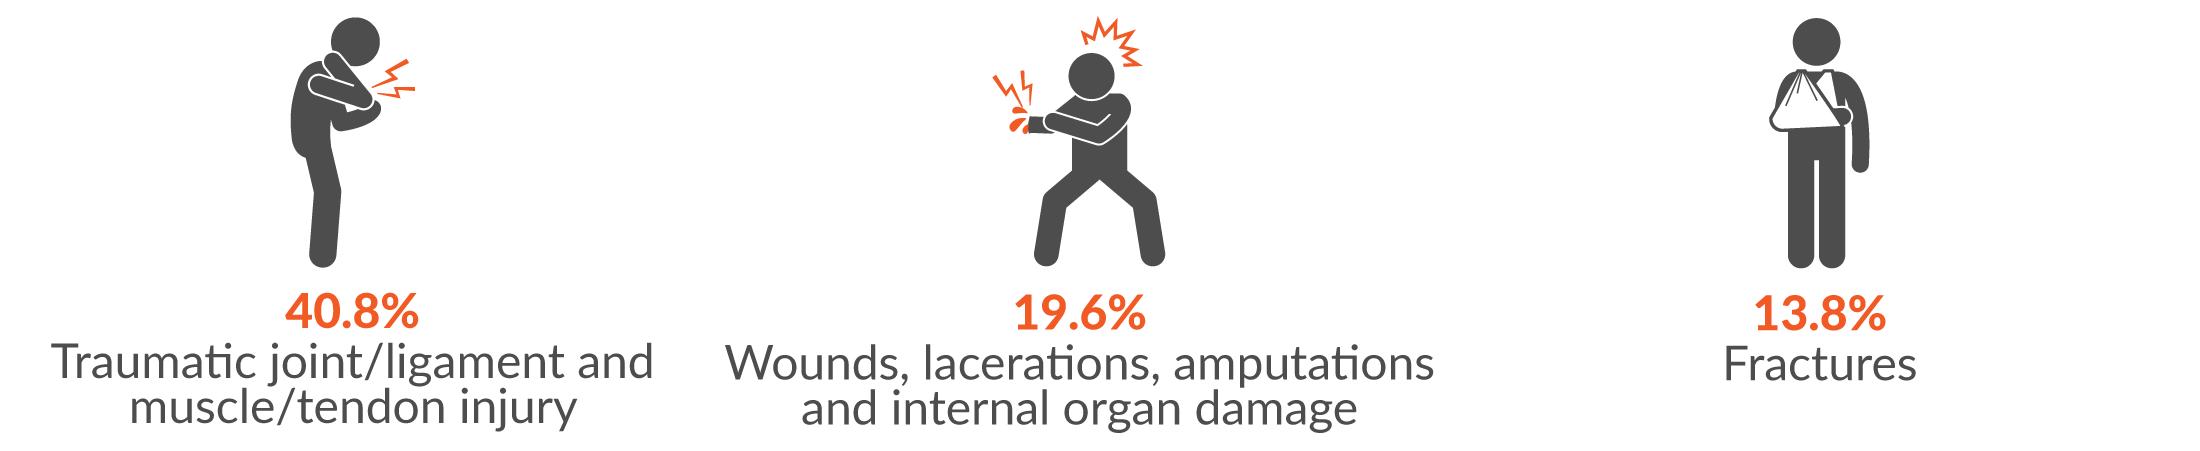
Main injury groups for serious injuries

This infographic shows the main three injury groups for serious injuries were 40.8% traumatic joint/ligament and muscle/tendon injury; 19.6% wounds, lacerations, amputations and internal organ damage; and 13.8% fractures.

Explanatory notes

Workers’ Compensation Claims from 1 July 2022 to 30 June 2023. Preliminary data subject to revision in subsequent years as claims are finalised.

  • Statistics are based on data gathered from workers compensation claims.
  • Australian and New Zealand Standard Industrial classification (ANZSIC) 1993 used to identify industry sectors.
  • Type of occurrence classification system (TOOCS) 3.1 used to identify mechanisms of injury.
  • Australian Standard Classification of Occupations (ASCO) 2nd edition used to identify occupations.
  • Claims where the worker needed at least one week off due to their injuries are considered serious injuries.

Work-related fatalities

This infographic shows there were five work-related fatalities in 2022-23.

  • In 2022-23, there were 4 worker fatalities and 1 fatality classified as a bystander. A bystander is a person killed as a result of someone else’s work activity, while not engaged in a work activity of their own.
  • The 2022-23 fatalities are currently under investigation. During the course of an investigation, a fatality may be determined as not work-related and the above figure will be adjusted accordingly during the next update.

* Please note this figure only includes work-related fatalities investigated by NT WorkSafe. Some fatalities in the Northern Territory may fall in the jurisdiction of other national agencies.

Work-related fatalities by industry

This infographic shows there is one work-related fatality for each of the following industries: Agriculture, Forestry and Fishing, Manufacturing, Retail Trade, Government Administration, Transport and Storage.

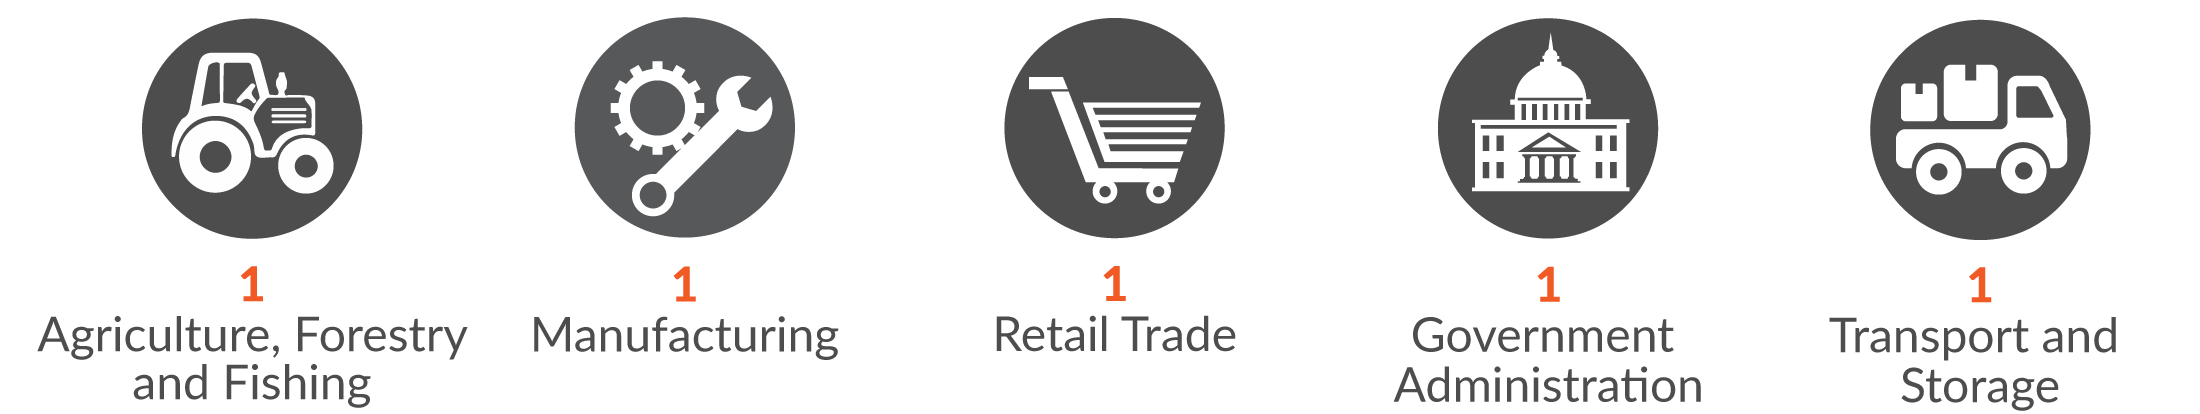
Work-related fatalities by mechanism of injury

This bar graph shows the work-related fatalities by mechanism of injury. One work-related fatality involved being assaulted by a person or persons; one work-related fatality involved being hit by moving objects; one work-related fatality involved drowning/immersion; and two work-related fatalities involved vehicle incidents.


Health and community services 22-23 →