2024-25 Work health and safety statistics – Health and Community Services

Key injury claims information
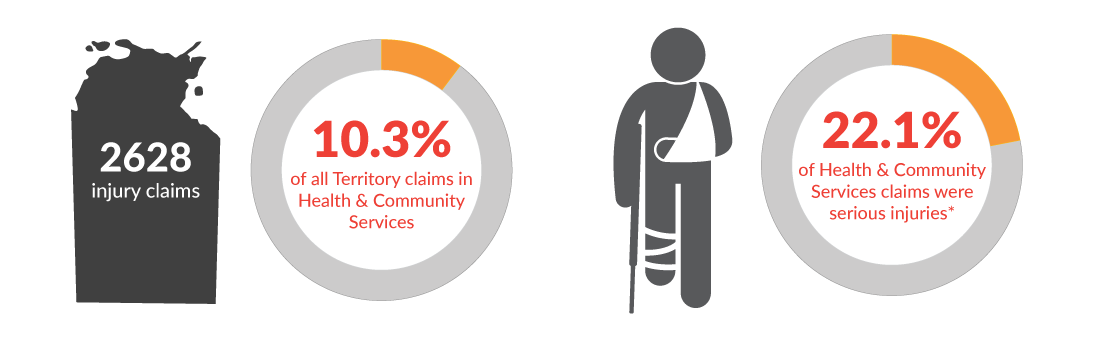
This infographic shows there were a total of 2628 workers' compensation claims in the Northern Territory for the year 2024-25. 10.3% of those claims were in Health and Community Services and 22.1% of those claims were for serious injuries.

This infographic shows there were 2 fatalities in Health and Community Service along with the total workers compensation claims resulted in 324 total lost time in weeks and $4,765,435 was paid in benefits.

* Claims where the worker needed at least one week off due to their injuries are considered serious injuries.

Injury claims by age and gender
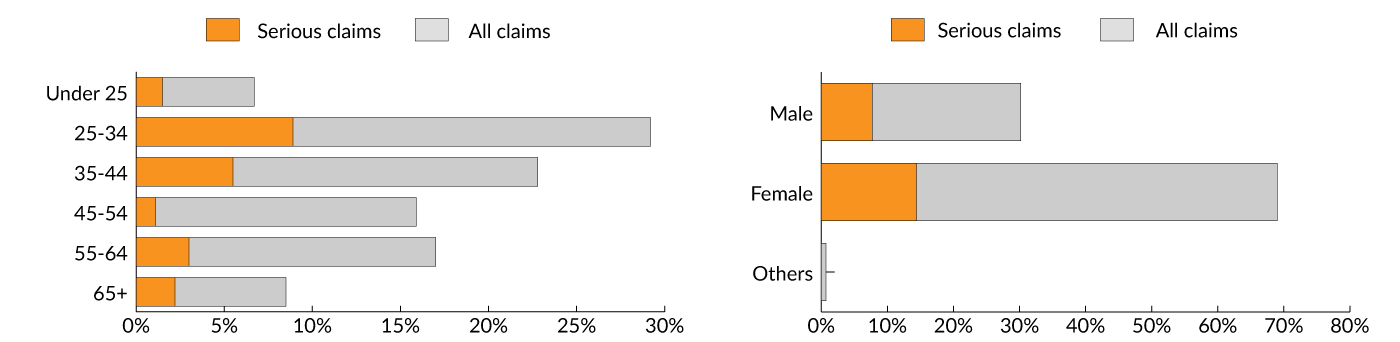
The image shows two bar graphs detailing injury claims by age and gender. In the age graph on the left, 6.6% of injuries occurred in workers under 25, and 1.5% of those claims were for a serious injury. 29.2% of injuries occurred in the 25 to 34 age bracket, and 8.9% of those claims were for a serious injury. 22.9% of injuries occurred in the 35 to 44 age bracket, and 5.5% of those claims were for a serious injury. 15.9% of injuries occurred in the 45 to 54 age bracket, and 1.1% of those claims were for a serious injury. 17% of injuries occurred in the 55 to 64 age bracket, and 3% of injured workers in that age bracket were seriously injured. 8.5% of injuries occurred in the 65+ age bracket, and 2.2% of injured workers in that age bracket were seriously injured. In the gender graph on the right, 30.3% of injured workers were male, 7.7% seriously injured, 69% of injured workers were female, with 14.4% serious injured and 0.7% of injured workers were from other gender with no serious injuries.

Main occupations seriously injured

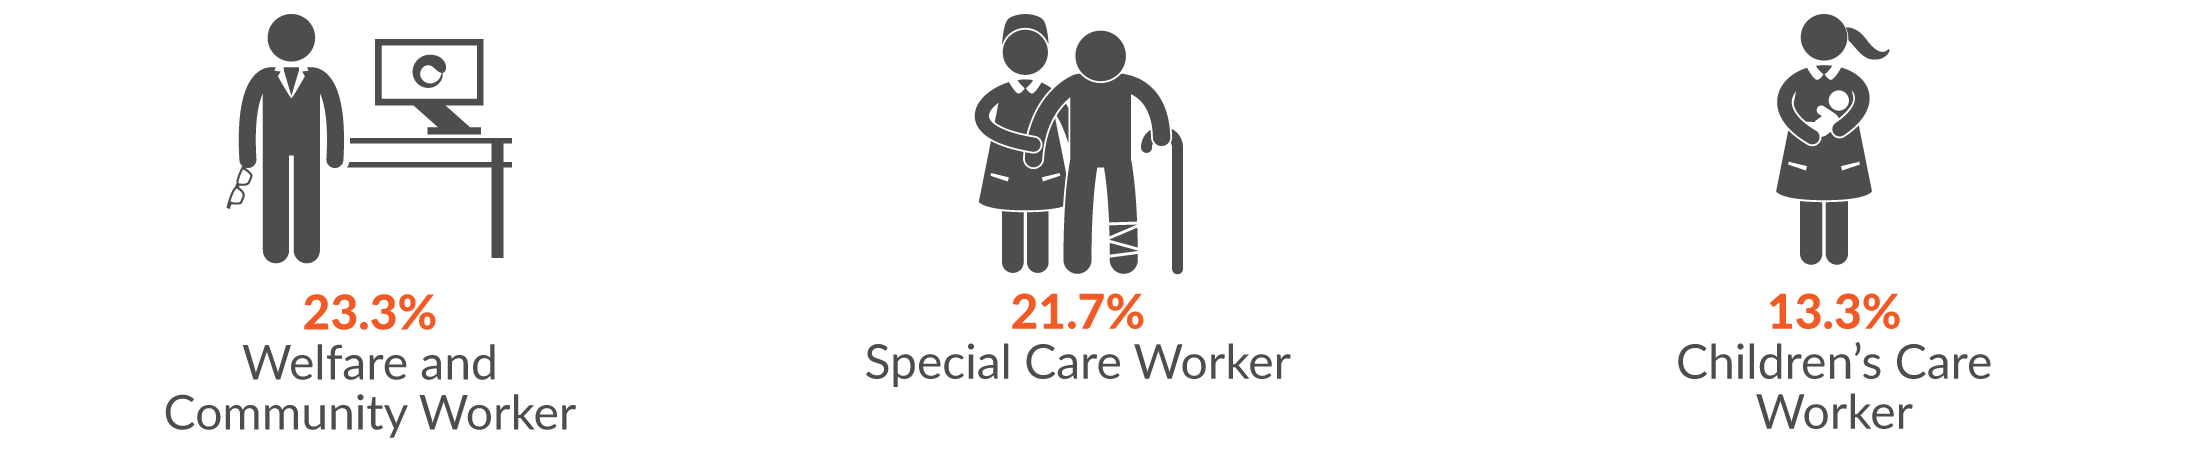
This infographic shows the main occupations by serious injury claims. 23.3% of all Health and Community Services serious injury claims were made by a welfare and community worker; 21.7% by Special Care Worker and 13.3% from Children's Care Worker.

Main industry sub-groups by serious injury claims
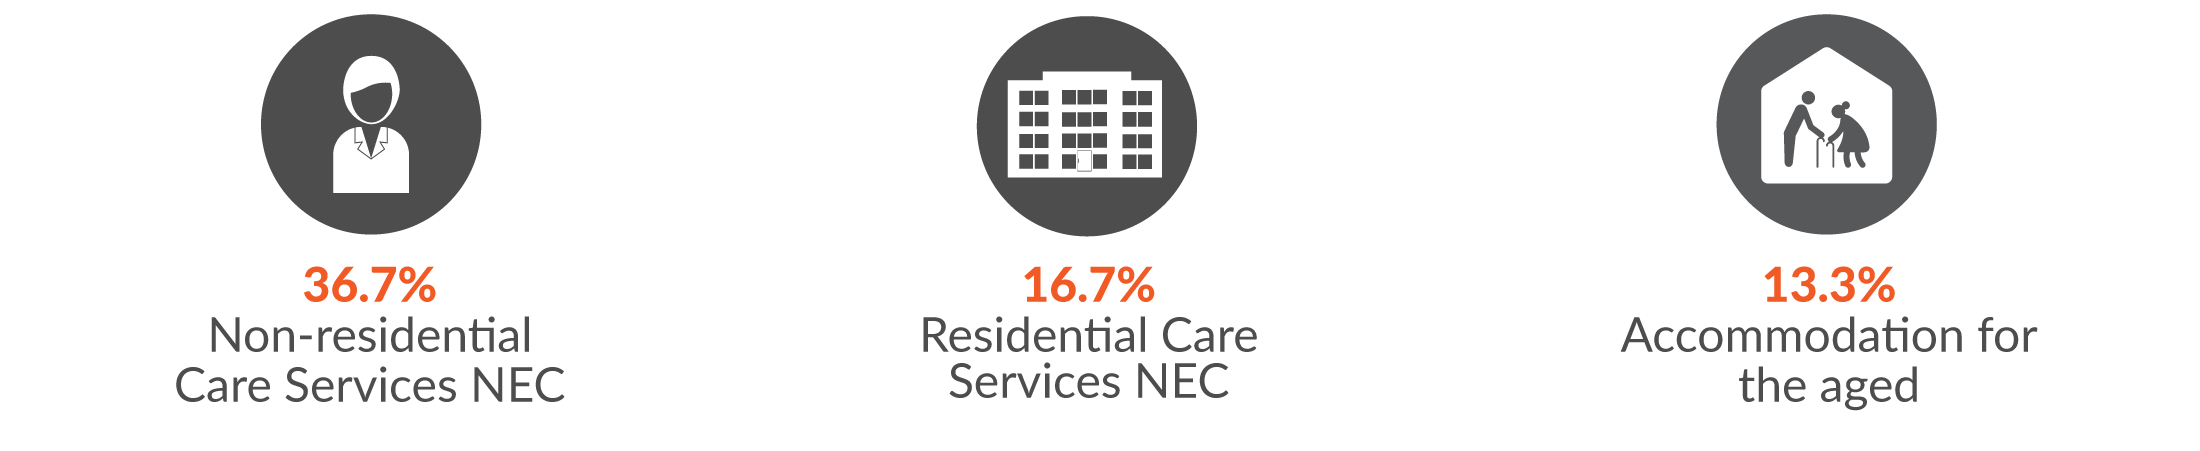
This infographic shows 36.7% of the health and community services serious injury claims were in Non-residential Care Services NEC, 16.7% in  Residential Care Services NEC and 13.3% in Accommodation for the aged.

Main mechanisms of serious injury

This infographic shows the main three mechanisms of serious injury for health and community services claims were 41.7% being hit by moving objects; 18.3% body stressing; and 18.3% falls, trips and slips of a person.

Break down by main mechanisms of serious injury

  • The four main injury groups resulting from being hit by moving objects were:
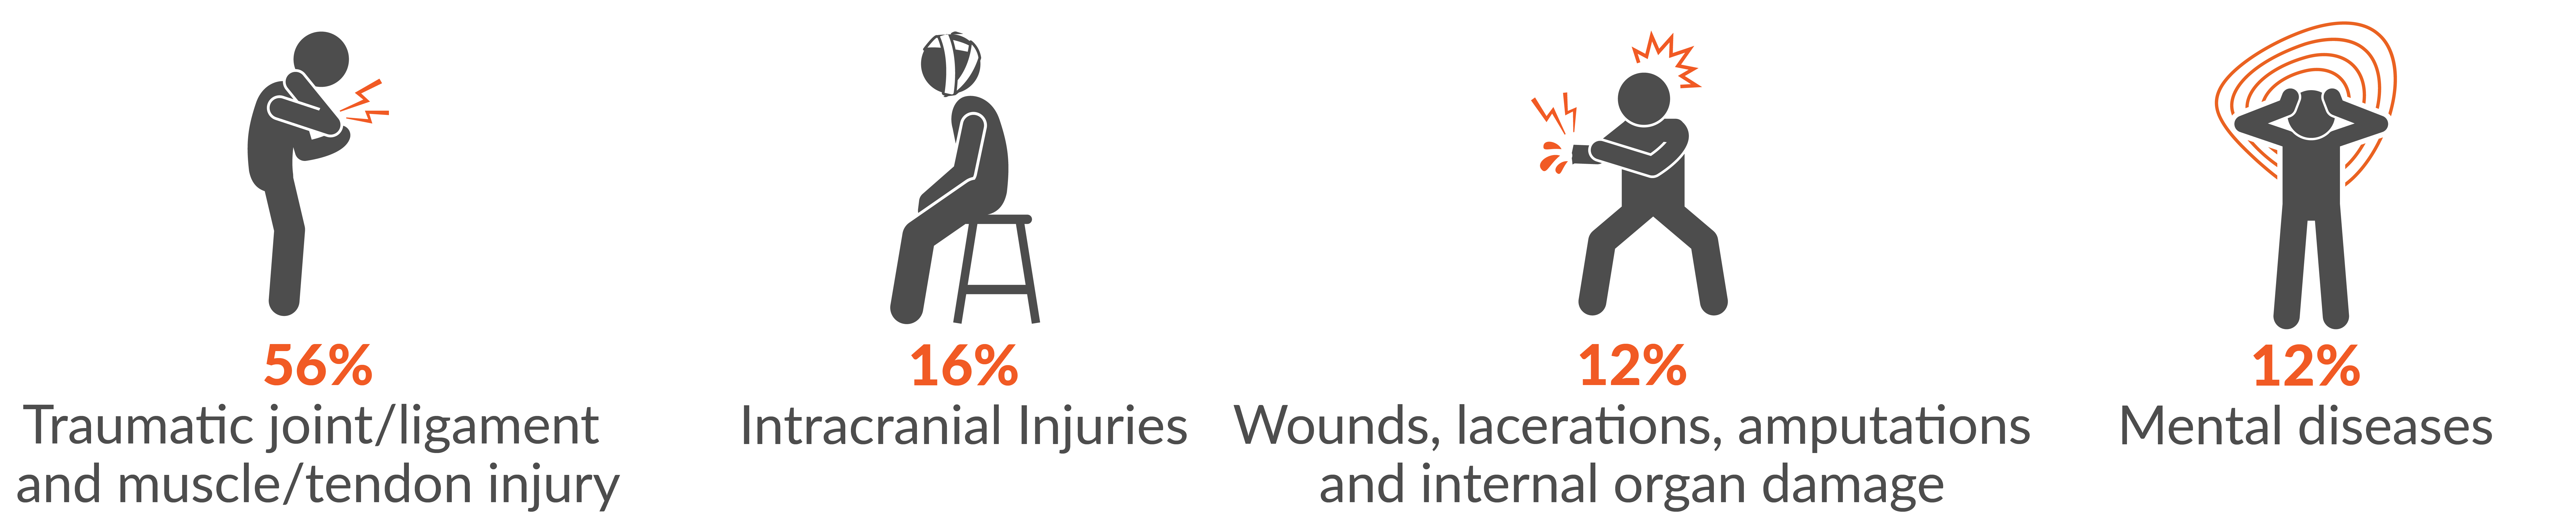
    56% traumatic joint/ligament and muscle/tendon injury, 16% Intracranial injuries, 12% wound, lacerations, amputations and 12% mental diseases.

    The main incident type was:

    • Being assaulted by a person or persons (88%)

    Main body areas injured were:

    • Brain (16%)
    • Psychological system in general (12%)
    • Hand (12%)
    • Head and other (8%)
    • Wrist (8%)

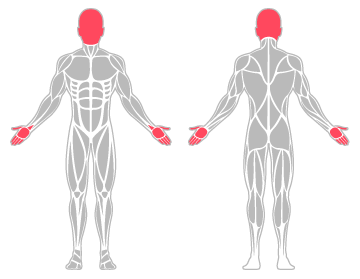
    The infographic shows the brain, psychological system in general, hand, head and other and wrist were the main body areas injured

  • The main injury groups resulting from being body stressing were:
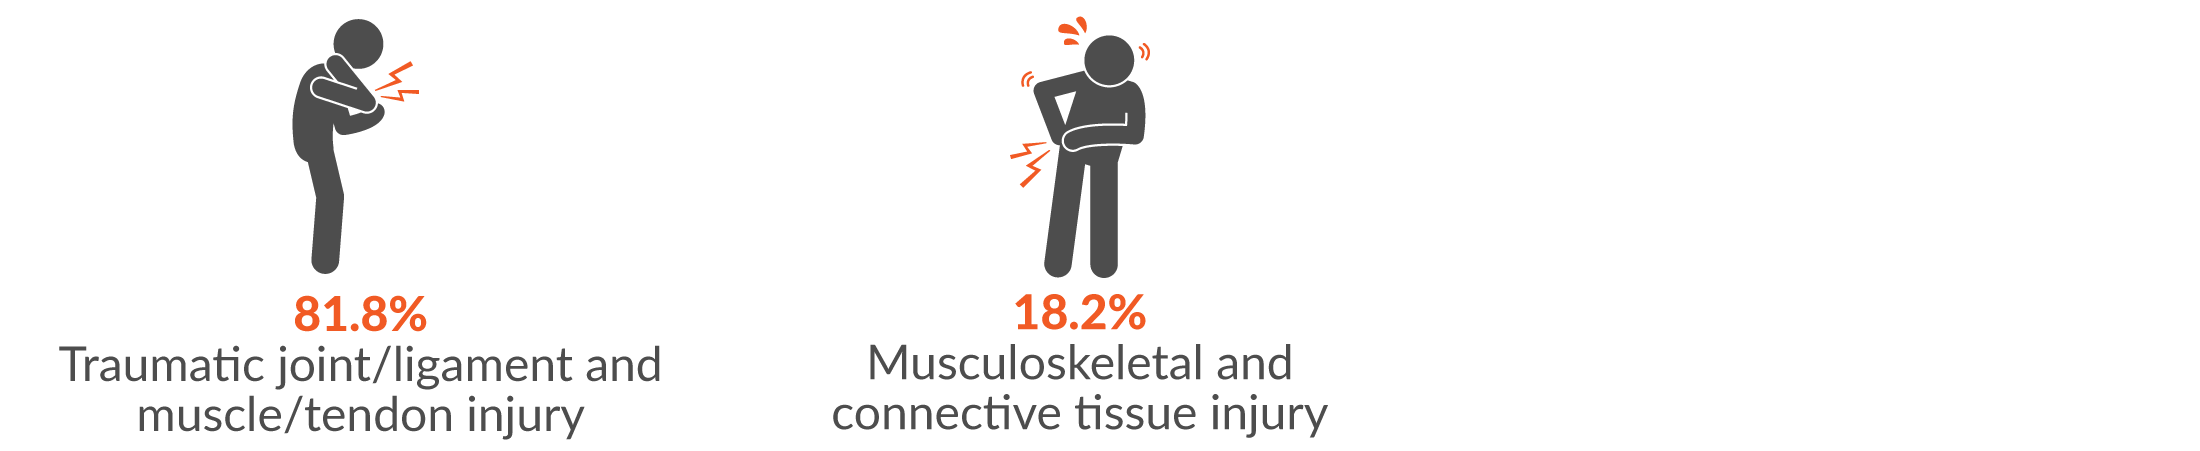
    81.8% traumatic joint/ligament and muscle/tendon injury and 18.2% musculoskeletal and connective tissue injury

    The three main incident types were:

    • Muscular stress while lifting, carrying, or putting
      down objects (36.4%)
    • Muscular stress while handling objects other than
      lifting, carrying or putting down (36.4%)
    • Repetitive movement low muscle loading (18.2%)

    Main body area injured was:

    • Lower back (27.3%)

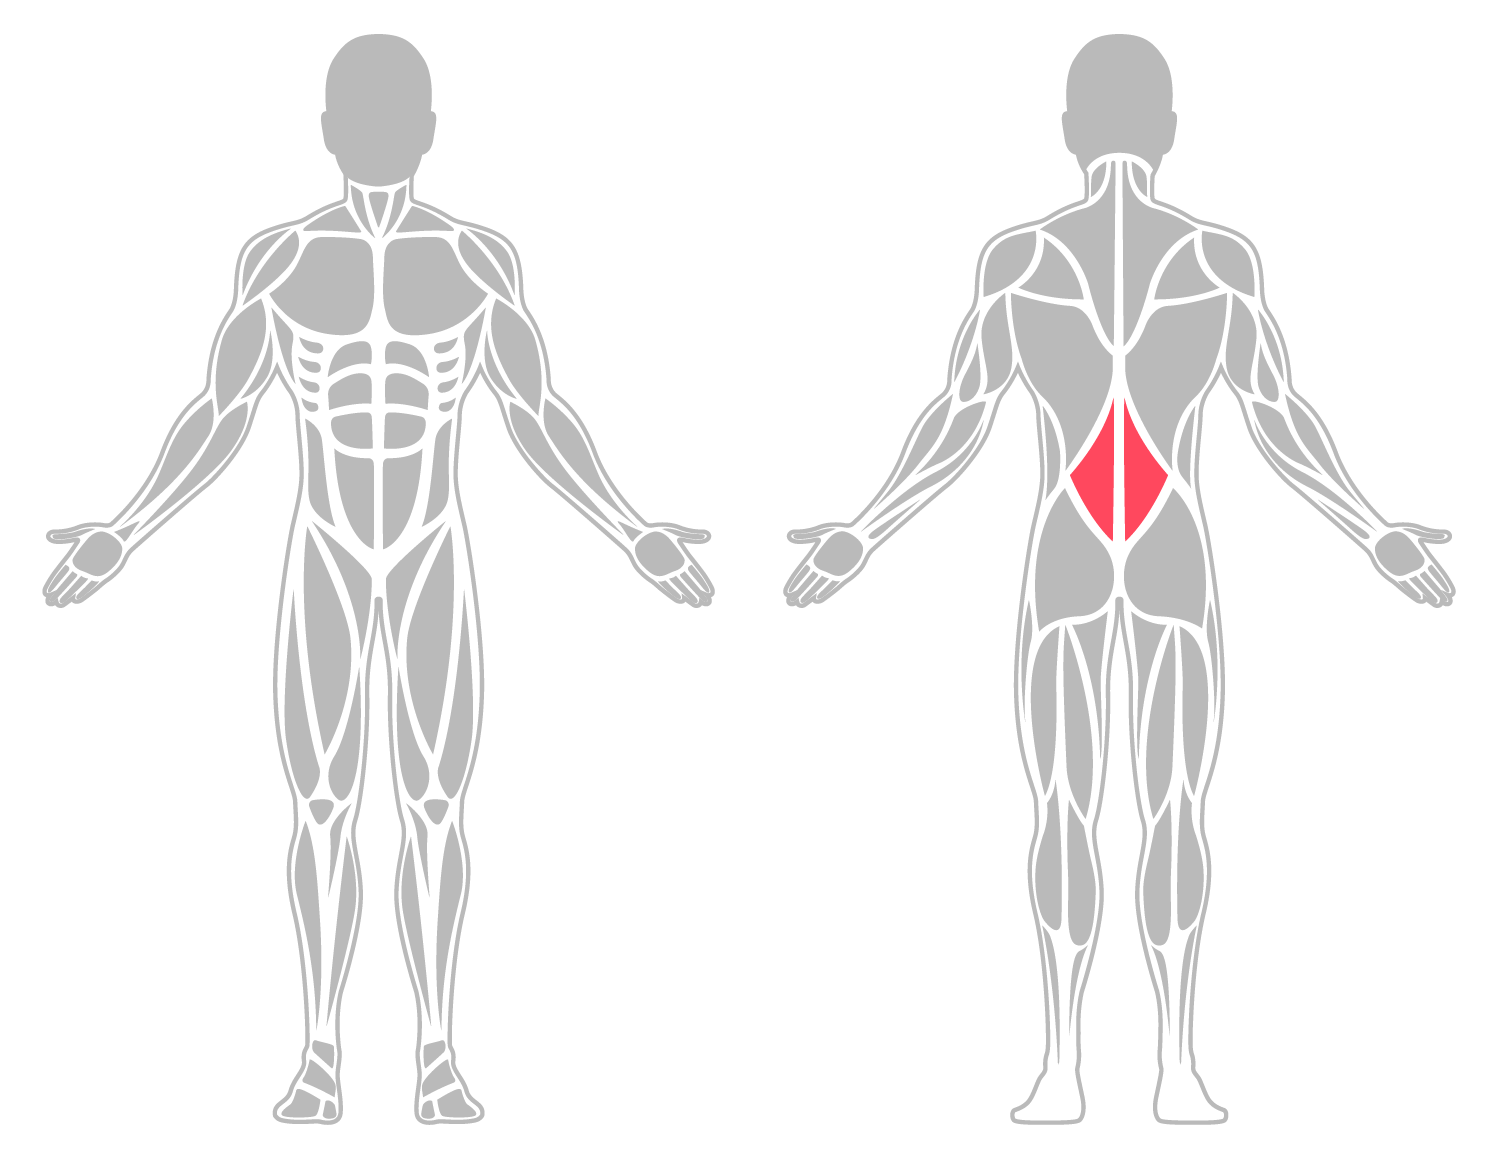
    The infographic shows lower back was the main body area injured.

  • The main injury groups resulting from falls, trips and slips of a person were:
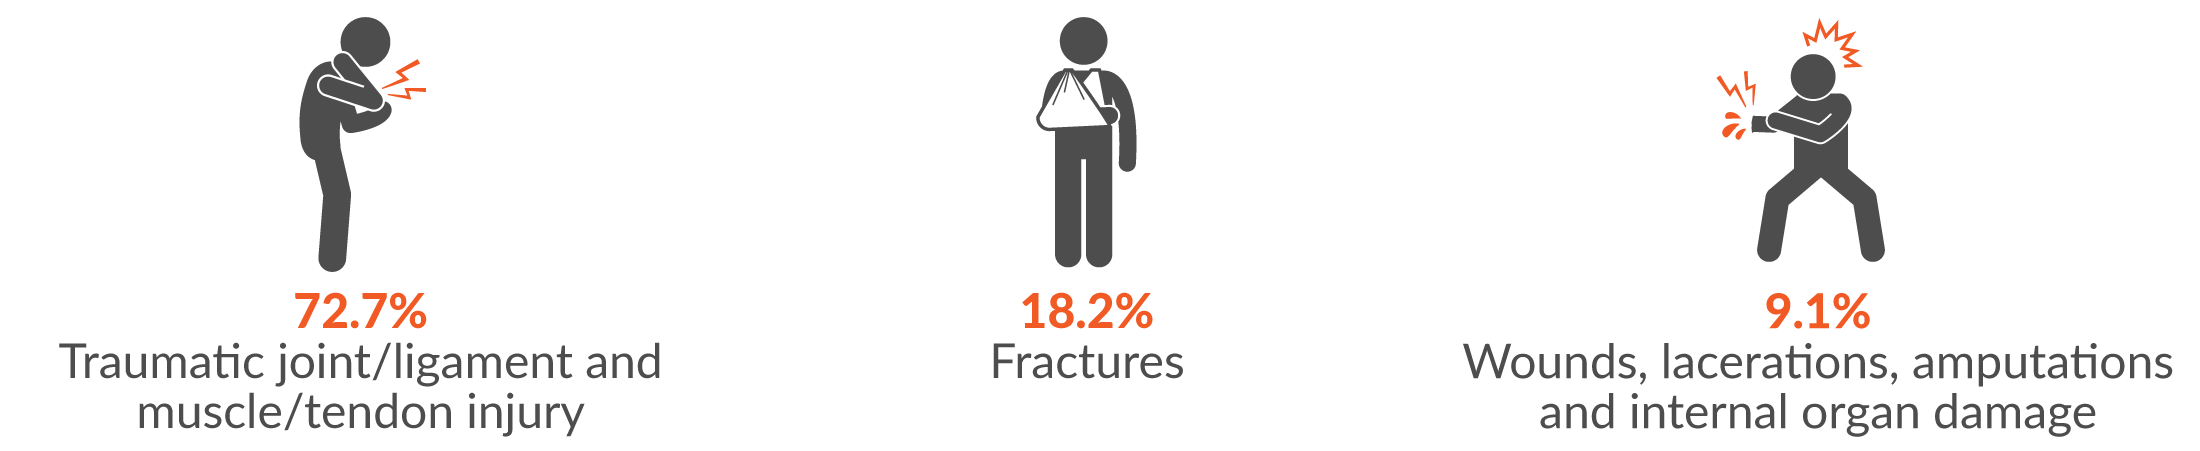
    72.7% traumatic joint/ligament and muscle/tendon injury, 18.2% fractures and 9.1% wound, lacerations, amputations

    The main incident type was:

    • Falls on the same level (100%)

    The main body areas injured were:

    • Knee (27.3%)
    • Ankle (18.2%)

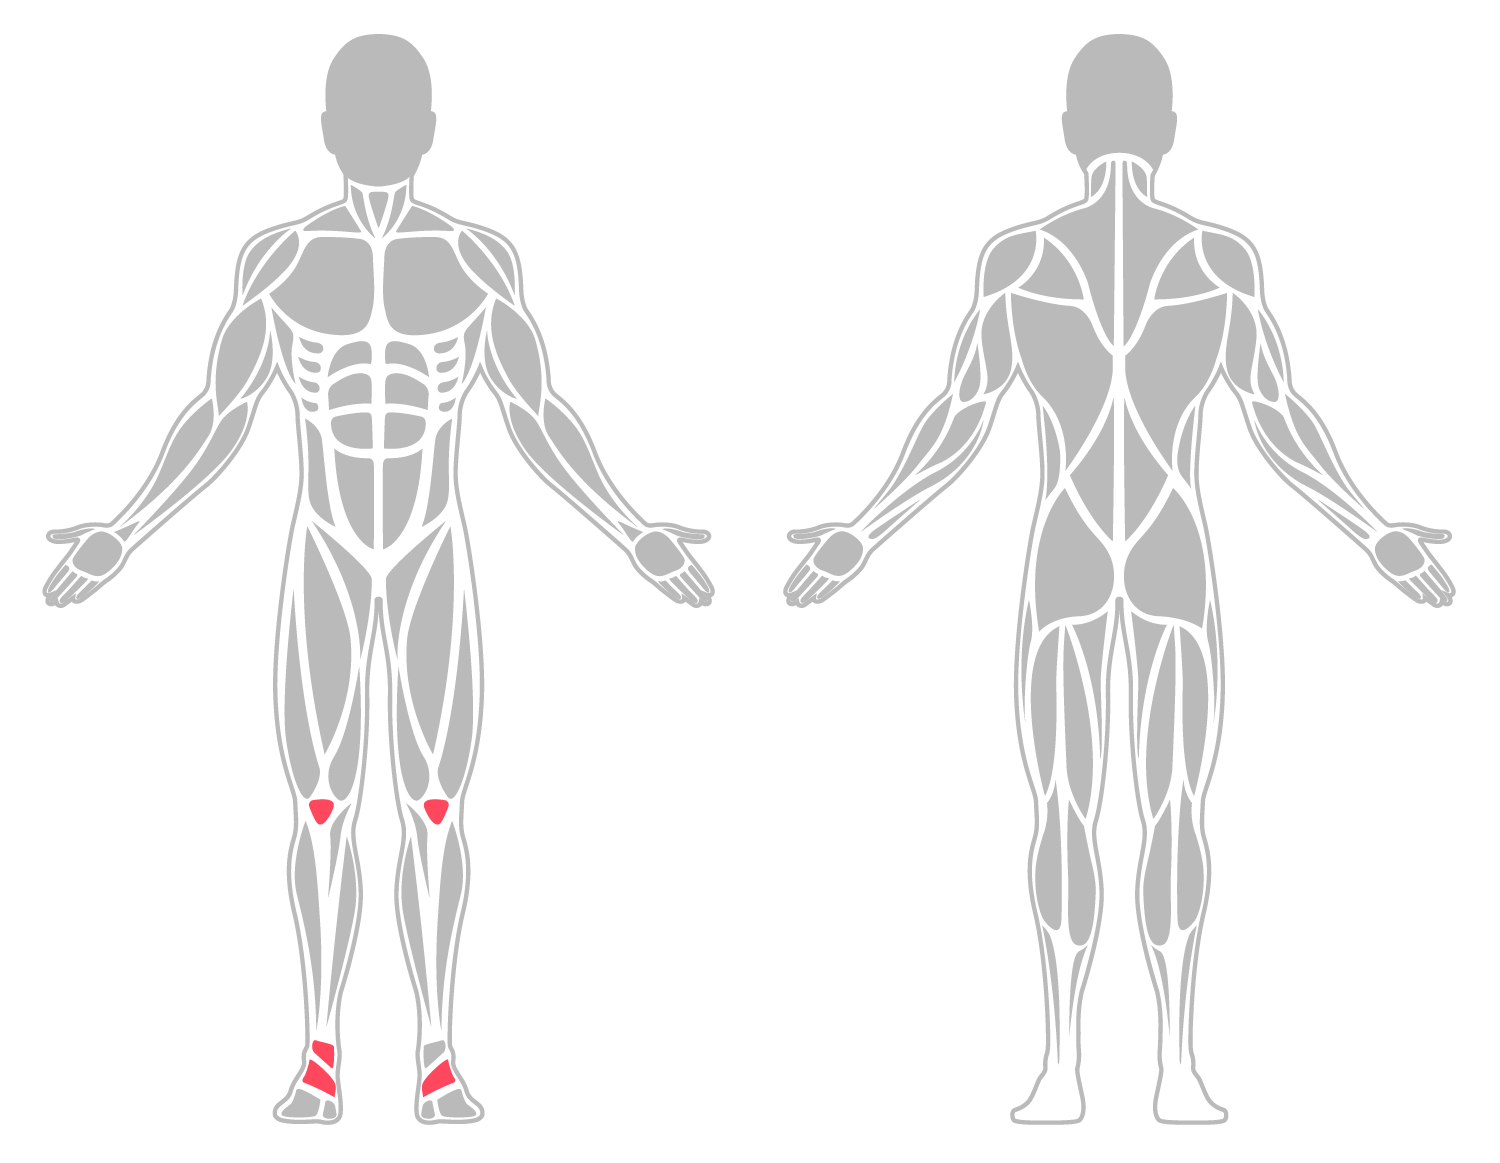
    The infographic shows the knee and ankle were the main body areas injured.