2024-25 Work health and safety statistics – Property and Business Services
Key injury claims information

* Claims where the worker needed at least one week off due to their injuries are considered serious injuries.
Injury claims by age and gender

Main occupations seriously injured
Main industry sub-groups by serious injury claims
Main mechanisms of serious injury
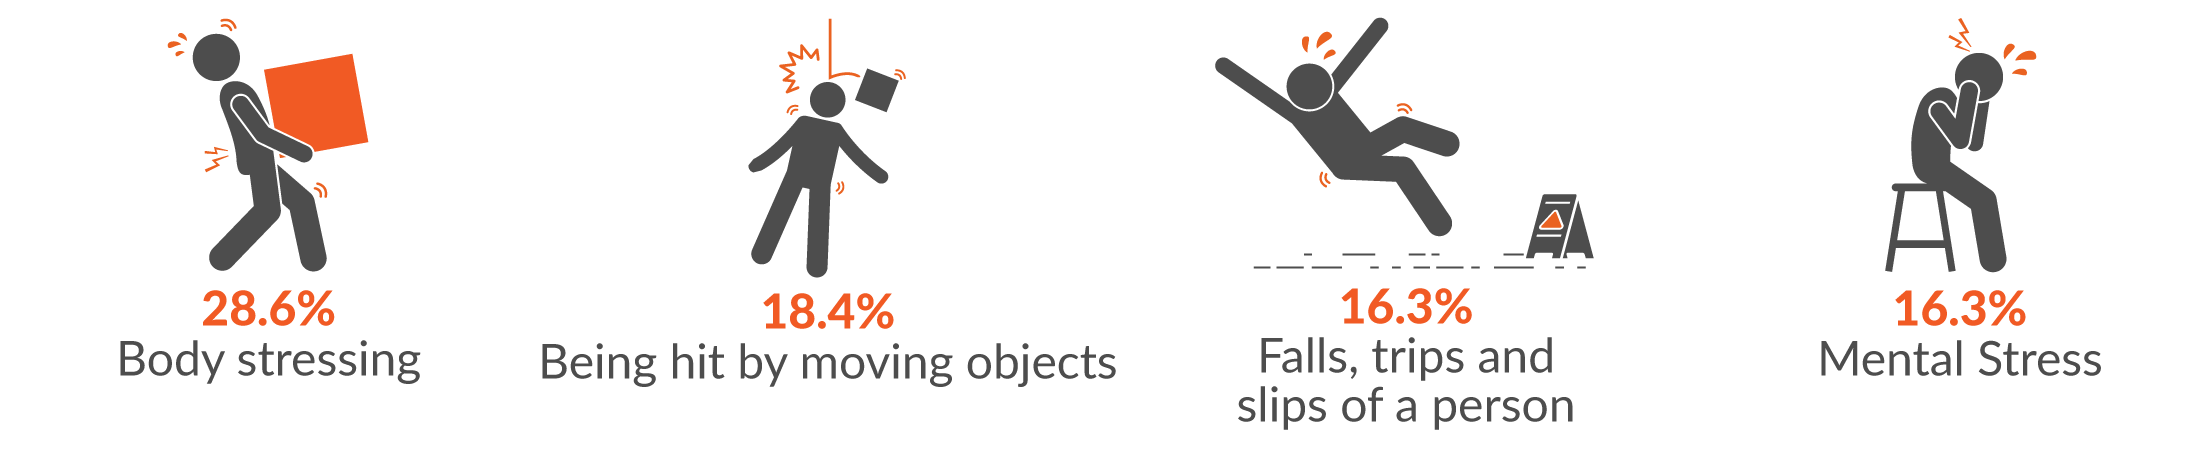
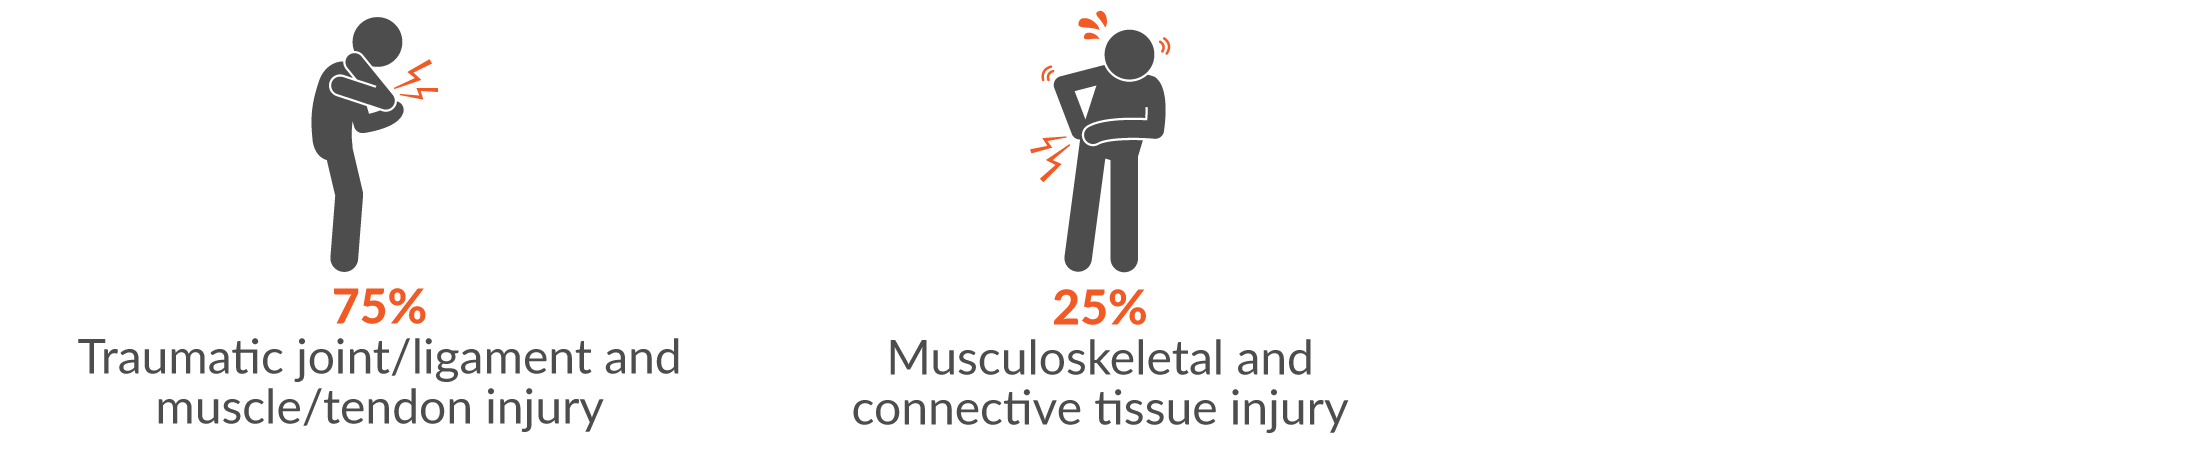
Break down by main mechanisms of serious injury
-
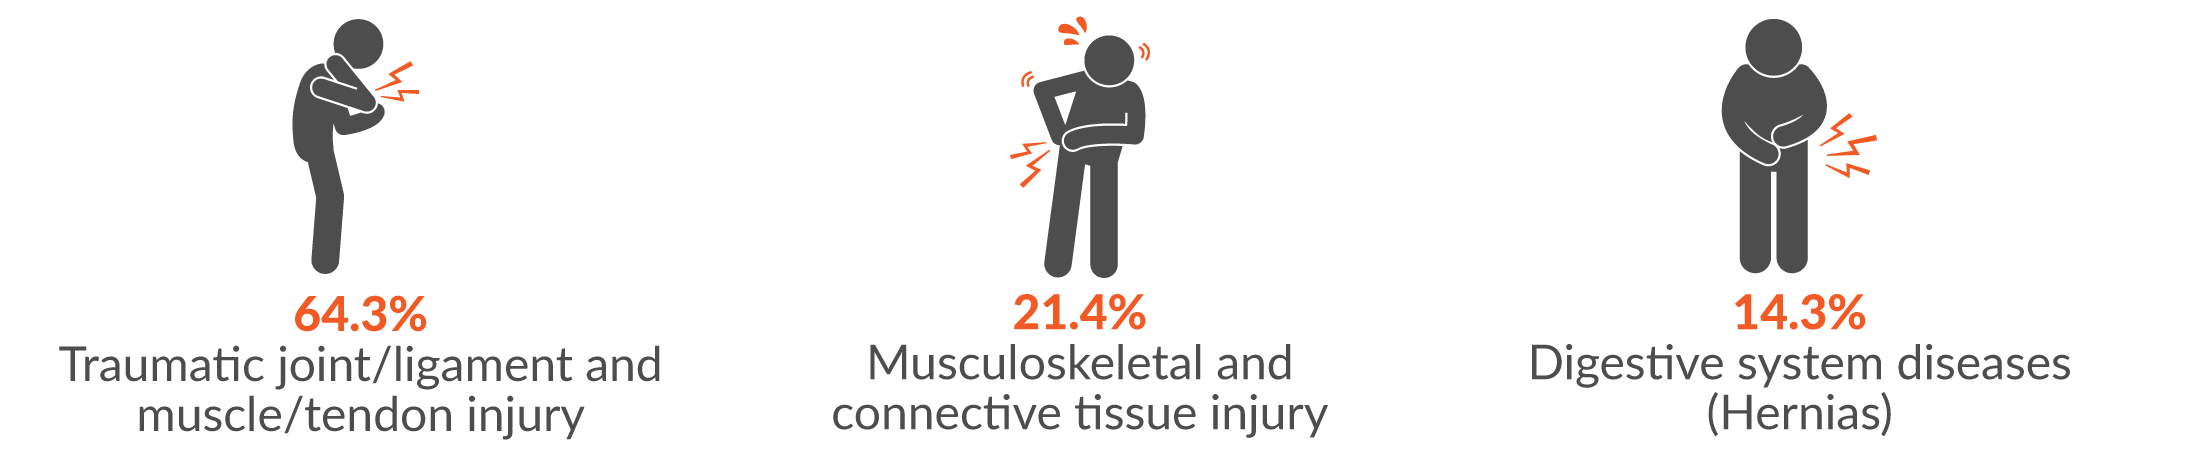
Body stressing
The main injury groups resulting from body stressing were:
The main incident types were:
- Muscular stress while lifting, carrying or putting down (71.4%)
- Muscular stress with no objects being handled (14.3%)
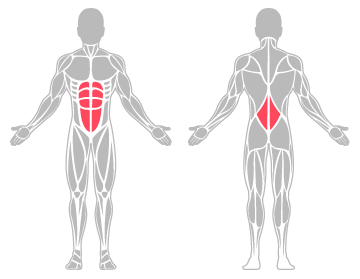
Main body areas injured were:
- Lower back (57.1%)
- Abdominal muscles and tendons (14.3%)
-
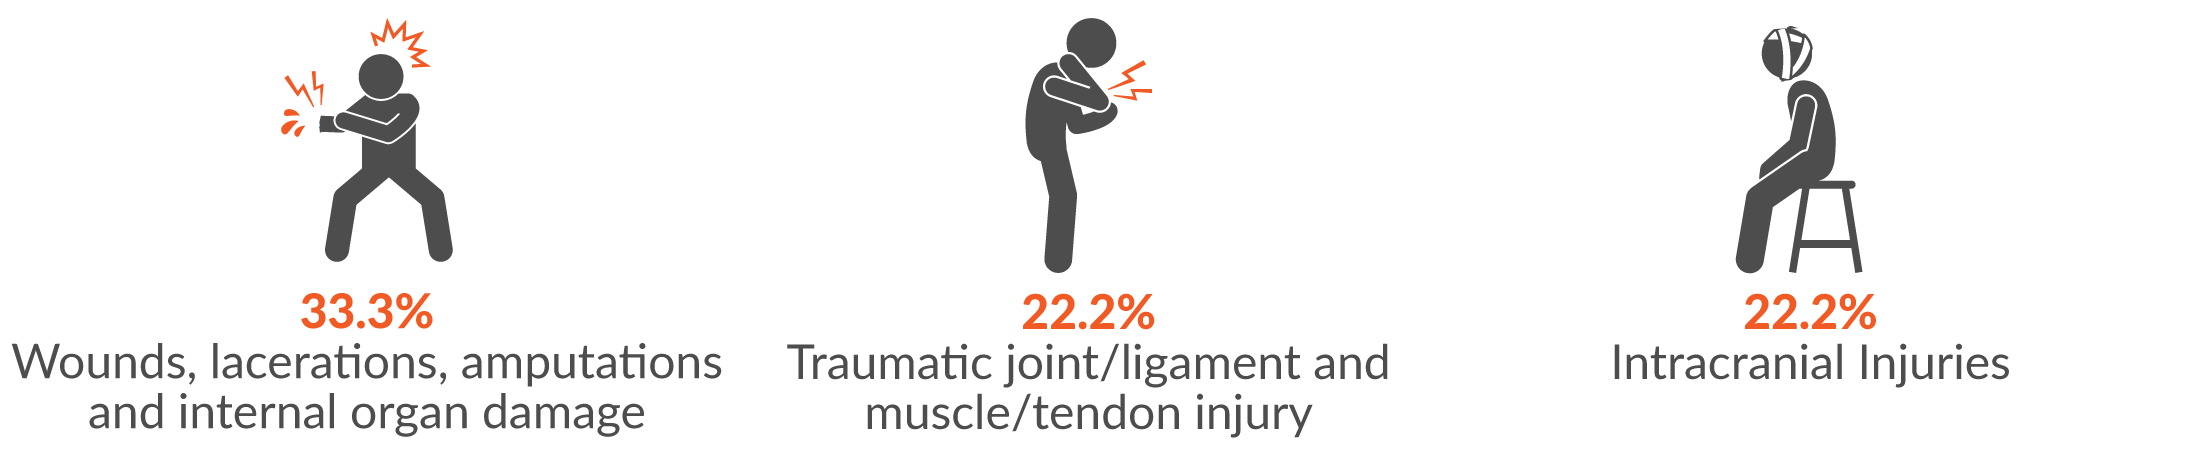
Being hit by moving object
The main three injury groups resulting from being hit by a moving object were:
The two main incident types were:
- Being assaulted by a person or persons (55.6%)
- Being hit by a moving object (33.3%)
The main body area injured was:
- Brain (22.2%)

-
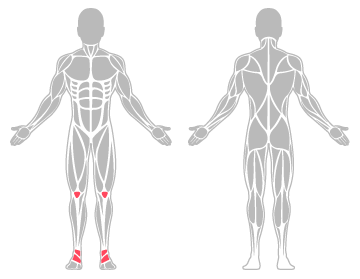
Falls, trips and slips of a person
The main two injury groups resulting from falls, trips and slips of a person were:
The two main incident types were:
- Fall on the same level (87.5%)
- Fall from a height (12.5%)
The main body areas injured were:
- Ankle (50.0%)
- Knee (37.5%)
-
Mental stress
The main two injury groups resulting from mental stress were:

The main incident types were:
- Work pressure (62.5%)
- Work related harassment and/or workplace bullying (25%)
The main body area injured was:
- Psychological system in general (100%)