2019-20 Work health and safety statistics - Accommodation, café and restaurants
Key injury claims information
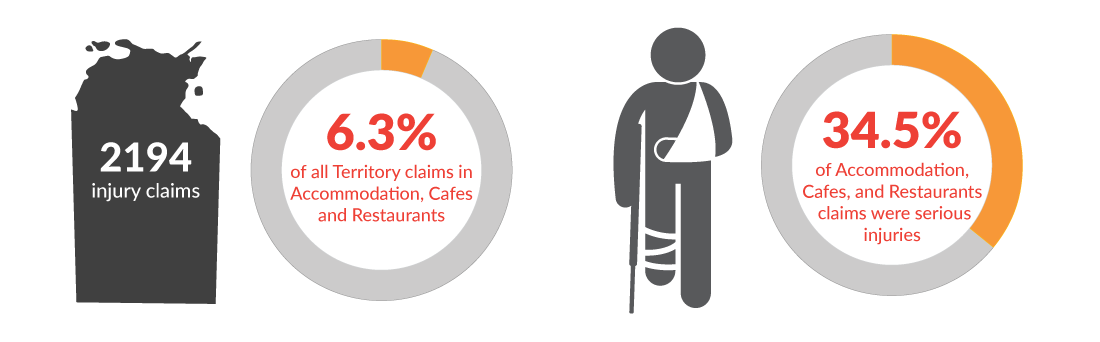

- Claims where the worker needed at least one week off due to their injuries are considered serious injuries.
Injury claims by age and gender

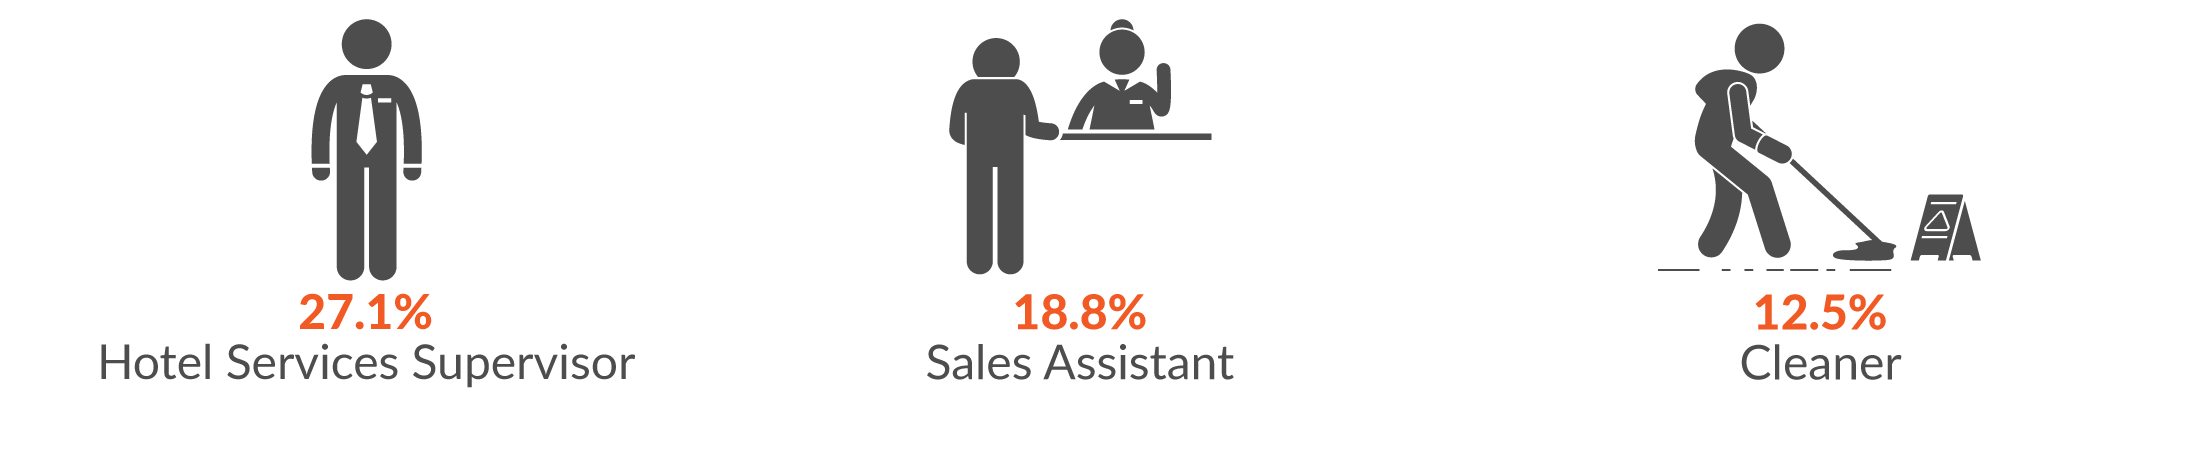
Main occupations seriously injured
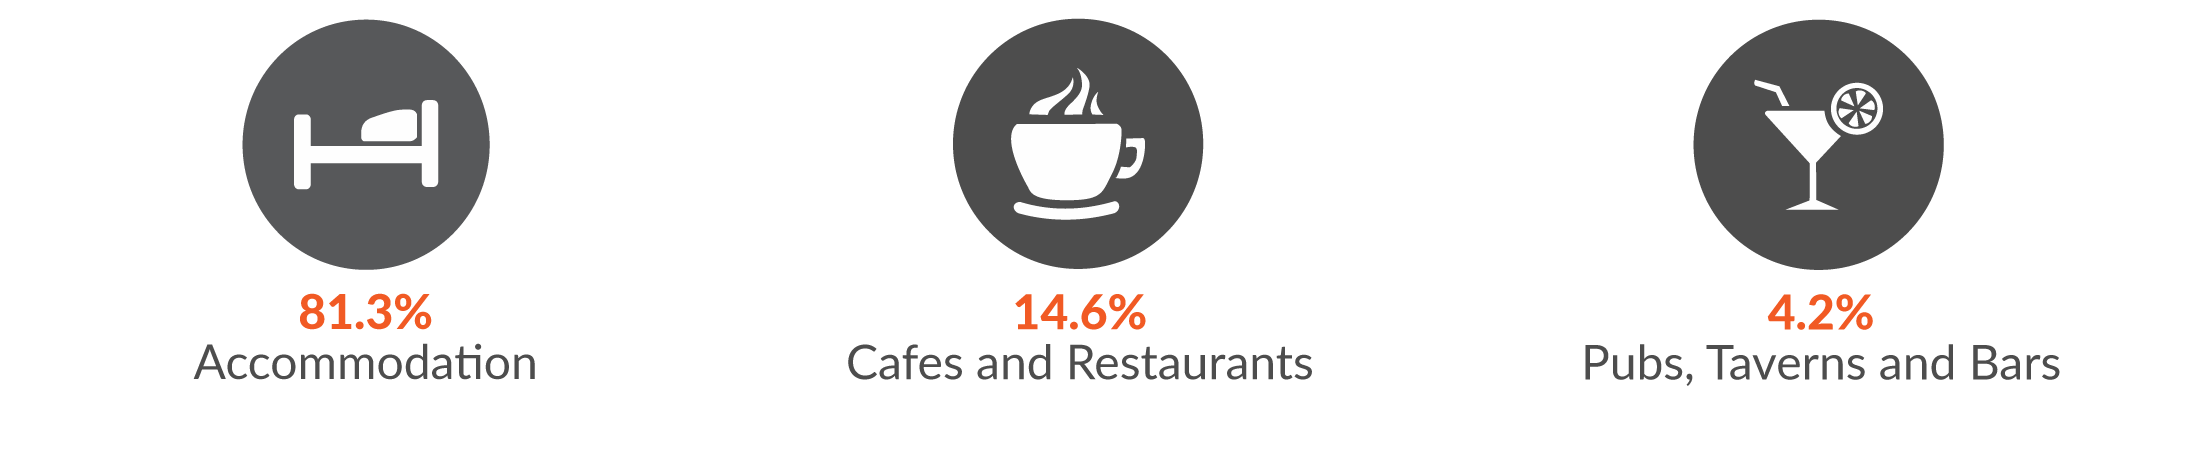
Main industry sub-groups by serious injury claims
Main mechanisms of serious injury
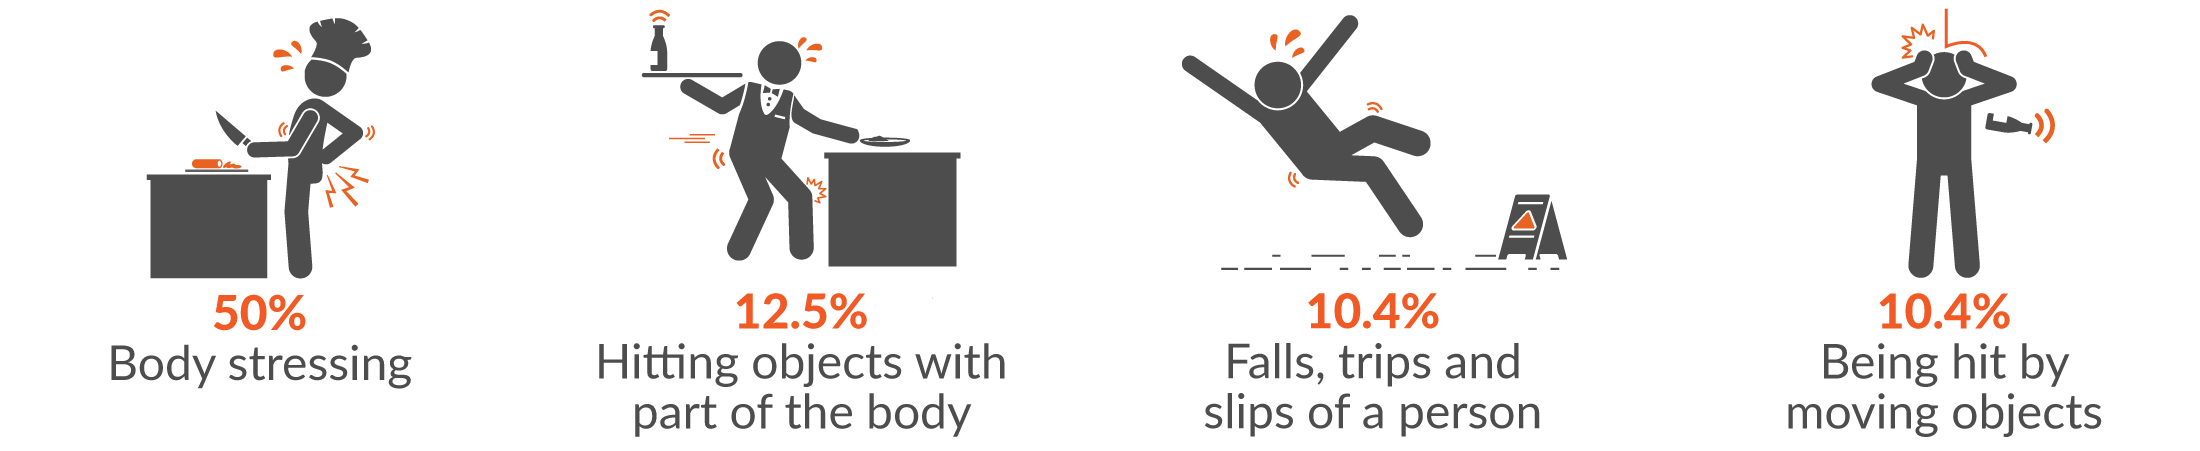
Break down by main mechanisms of serious injury
-
Body stressing
The main two injury groups resulting from body stressing were:
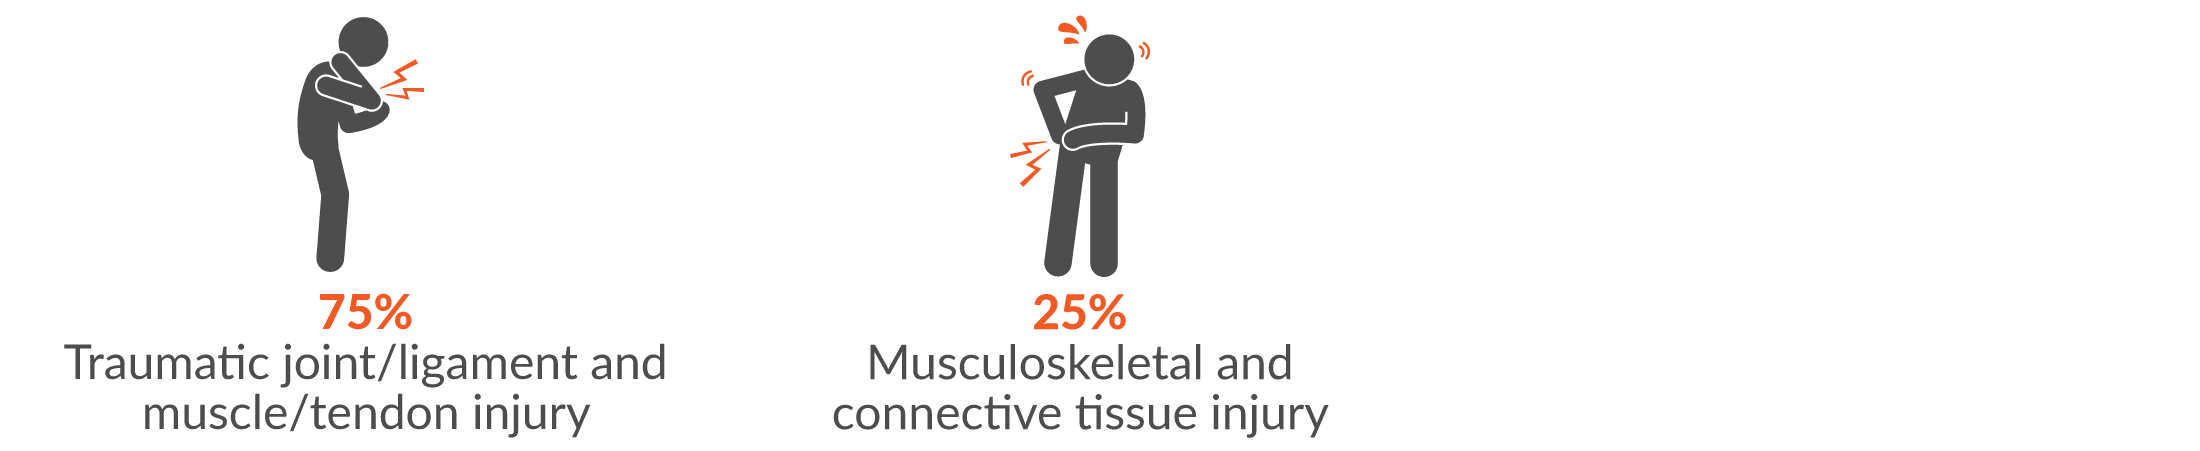
The three main incident types were:
- Muscular stress while lifting, carrying, or putting down objects (37.5%)
- Muscular stress while handling objects other than lifting, carrying or putting down (33.3%)
- Muscular stress with no objects being handled (29.2%)
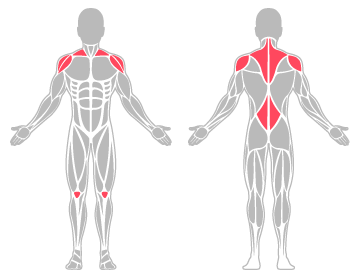
Main body areas injured were:
- Lower back (20.8%)
- Shoulder (20.8%)
- Knee (16.7%)
-
Hitting objects with a part of the body
The main injury group resulting from hitting objects with a part of the body was:
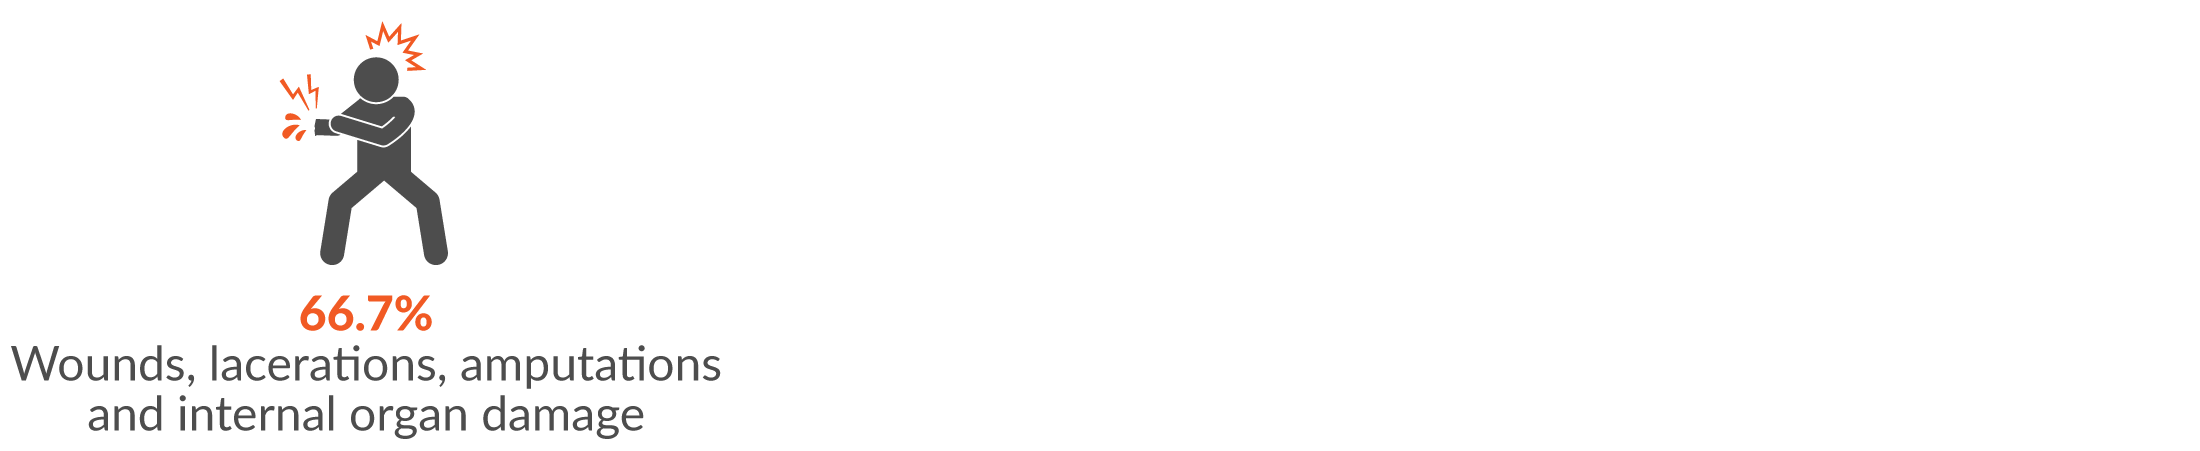
The two main incident types were:
- Hitting stationary objects (66.7%)
- Hitting moving objects (33.3%)
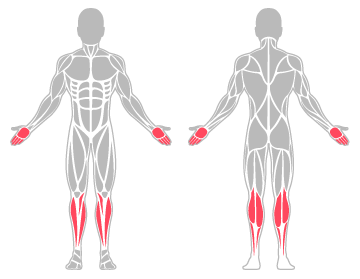
Main body areas injured were:
- Fingers (33.3%)
- Hand (33.3%)
- Lower leg (16.7%)
-
Falls, trips and slips of a person
The main injury group resulting from falls, trips and slips of a person was:
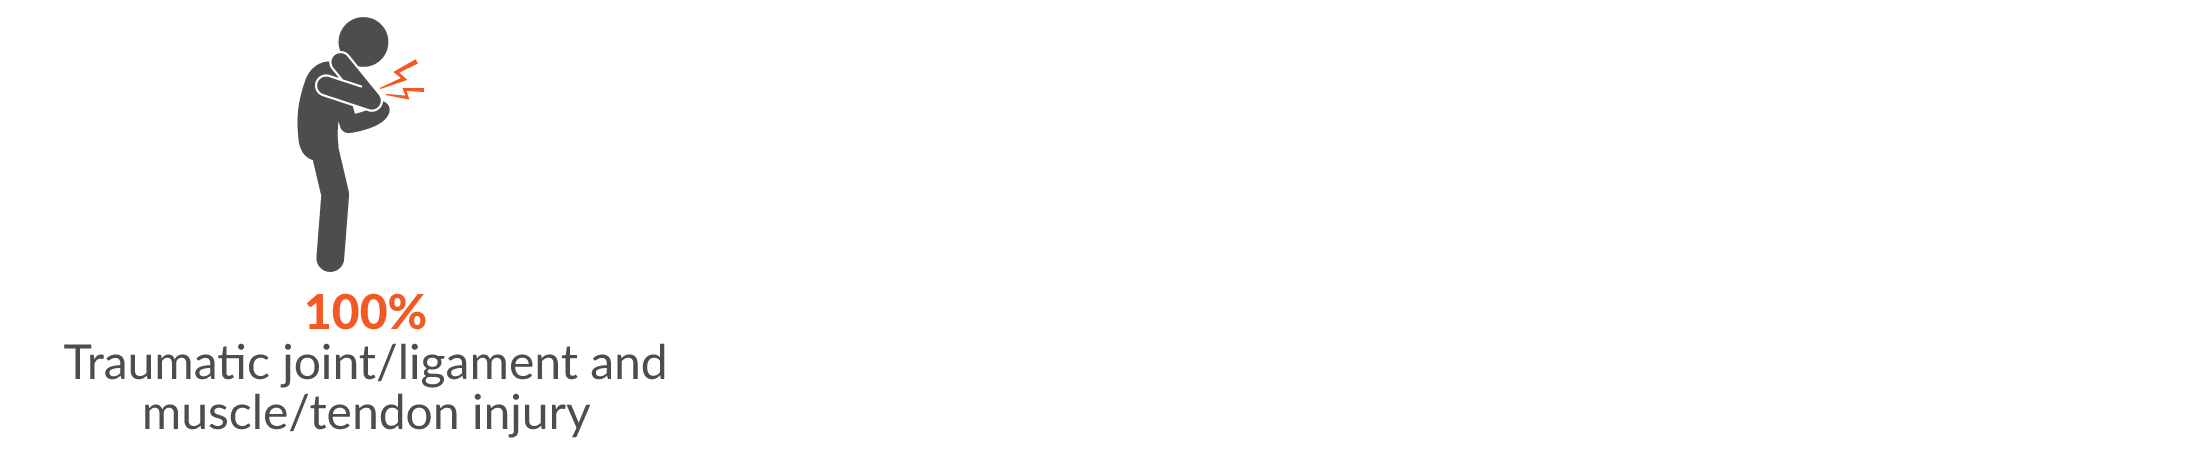
The two main incident type were:
- Falls on the same level (60%)
- Falls from a height (40%)
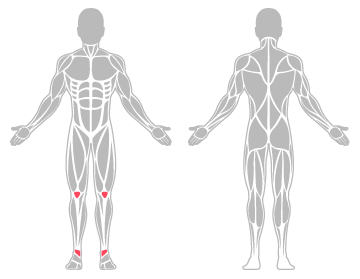
Main body areas injured were:
- Ankle (60%)
- Knee (40%)
-
Being hit by moving object
The main injury group resulting from falls, trips and slips of a person was:
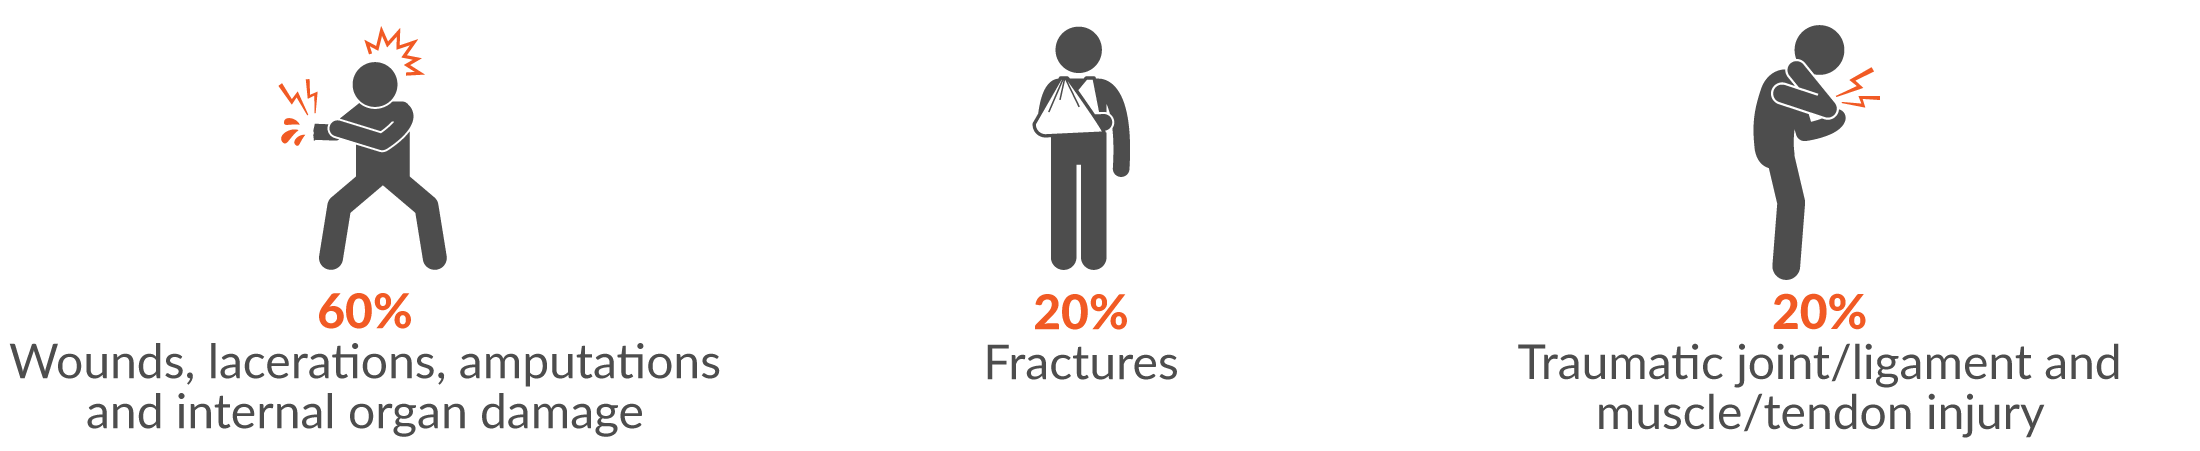
The three main incident types were:
- Being hit by falling objects (60%)
- Being trapped by moving machinery or equipment (20%)
- Being hit by animal (20%)
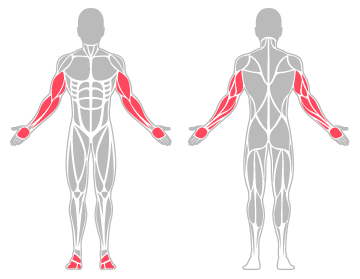
Main body areas injured were:
- Forearm (40%)
- Upper arm (20%)
- Hand (20%)
- Foot (20%)
Previously published infographics
The above information provides additional details to the Accommodation, Cafés and Restaurants infographics published in October 2020. The serious injury specific infographics for Accommodation, Cafés and Restaurants for 2019-20 is still available here (pdf 179.1 KB).
← Agriculture, forestry and fishing 19-20