2019-20 Work health and safety statistics - Agriculture, forestry and fishing

Key injury claims information

This infographic shows there were a total of 2194 workers' compensation claims in the Northern Territory for the year 2020-21. 8.8% of those claims were in Agriculture, forestry and fishing and 32.3% of those claims were for serious injuries.

This infographic shows the total workers compensation claims in Agriculture, forestry and fishing resulted in 1029 total lost time in weeks and $3,519,831 was paid in benefits.

  • Claims where the worker needed at least one week off due to their injuries are considered serious injuries.

Injury claims by age and gender

 The image shows two bar graphs detailing injury claims by age and gender. In the age graph, 47.4% of injuries occurred in workers under 25, and 44% of those claims were for a serious injury.  25% of injuries occurred in the 25 to 34 age bracket, and 27.1% of those claims were for a serious injury. 10.9% of injuries occurred in the 35 to 44 age bracket, and 19% of those claims were for a serious injury. 8.3% of injuries occurred in the 45 to 54 age bracket, and 25% of those claims were for a serious injury. 6.3% of injuries occurred in the 55 to 64 age bracket, however none of the workers in that age bracket were seriously injured. 2.1% of injuries occurred in the 65+ age bracket, and 25% of injured workers in that age bracket were seriously injured. In the gender graph, 69.8% of injured workers were male, 24% seriously injured, and 30.2% of injured workers were female, with 8% serious injured.

Main occupations seriously injured

This infographic shows the main occupations by serious injury claims. 82.3% of Agriculture, forestry and fishing serious injury claims were made by a Farm Hand; and 8.1% by Seafarers and Fishing Hands.

Main industry sub-groups by serious injury claims

This infographic shows 72.6% of Agriculture, forestry and fishing serious injury claims were in Beef Cattle Farming and 4.8% in the following three industry sub-groups, Aquaculture, Services to Agriculture NEC, and forestry (al1 4.8%).

Main mechanisms of serious injury

This infographic shows the main three mechanisms of serious injury for Agriculture, forestry and fishing claims were 38.7% being hit by moving object; 22.6% falls, trips and slips of a person; and 14.5% hitting objects with a part of the body.

Break down by main mechanisms of serious injury

  • The main three injury groups resulting from being it by moving objects were:

    33.3% wounds, lacerations, amputations and internal organ damage; 29.2% traumatic joint/ligament and muscle/tendon injury; and 29.2% fractures.

    The three main incident type were:

    • Being hit by an animal (37.5%)
    • Being trapped between stationary and moving objects (20.8%)
    • Being trapped by moving machinery or equipment (12.5%)
    • Being hit by falling objects (12.5%)

    Main body area injured was:

    • Thumb (12.5%)
    • Lower leg (12.5%)
    • Foot (12.5%)

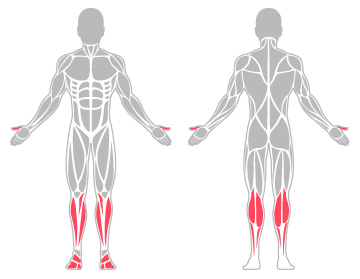
    The infographic shows the thumb, lower leg and foot were the main body areas injured.

  • The main three injury groups resulting from falls, trips and slips of a person were:

    42.9% fractures; 28.6% wounds, lacerations, amputations and internal organ damage; and 28.6% traumatic joint/ligament and muscle/tendon injury.

    The main incident type was:

    • Falls from a Height (92.9%)

    Main body areas injured were:

    • Shoulder (21.4%)
    • Ankle (21.4%)
    • Forearm (14.3%)
    • Upper back (14.3%)

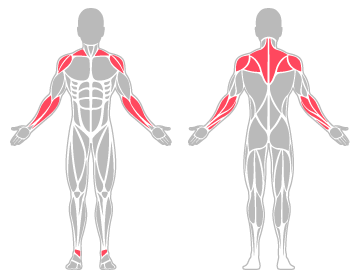
    The infographic shows the shoulder, ankle, forearm and upper back were the main body areas injured.

  • The main injury group resulting from hitting objects with a part of the body was:

    77.8% wounds, lacerations, amputations and internal organ damage.

    The two main incident type were:

    • Hitting moving objects (44.4%)
    • Hitting stationary objects (44.4%)

    Main body areas injured were:

    • Fingers (22.2%)
    • Thumb (22.2%)

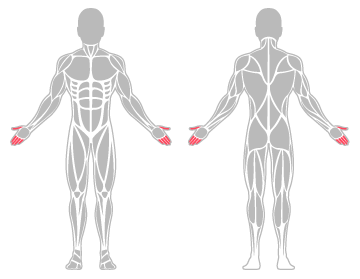
    The infographic shows the fingers and thumb were the main body areas injured.

Previously published infographics

The above information provides additional details to the Agriculture, forestry and fishing infographics published in October 2020. The serious injury specific infographics for Agriculture, forestry and fishing for 2019-20 is still available here (pdf 212.0 KB).


← Government administration and defence 19-20

Accommodation, cafe and restaurants 19-20 →