2019-20 Work health and safety statistics - Health and community services
Key injury claims information
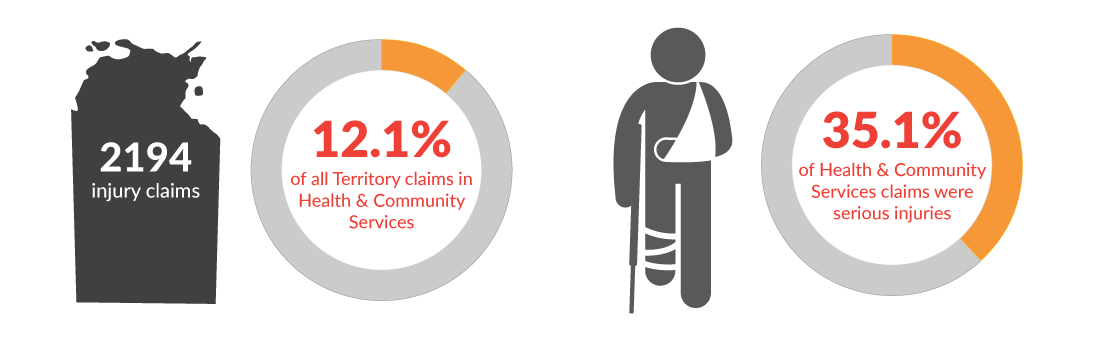

- Claims where the worker needed at least one week off due to their injuries are considered serious injuries.
Injury claims by worker age and gender

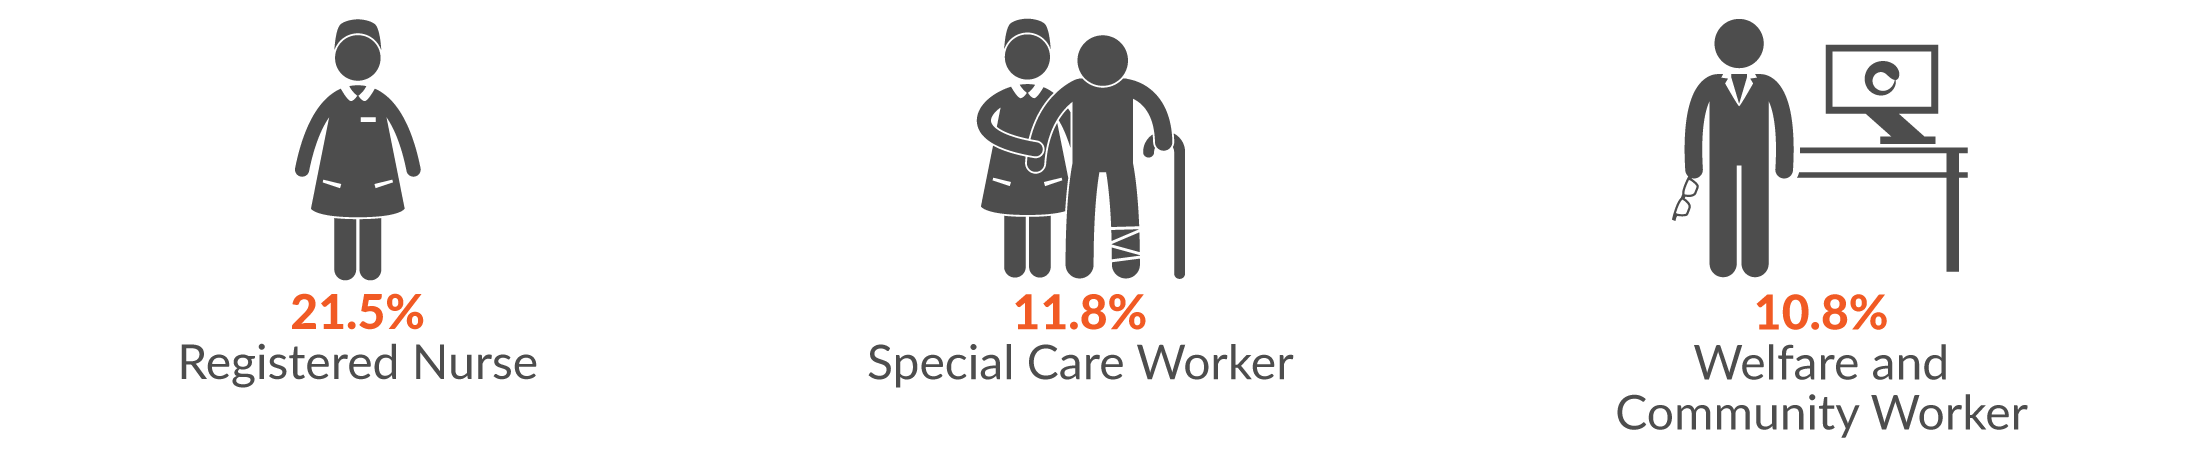
Main three occupations seriously injured
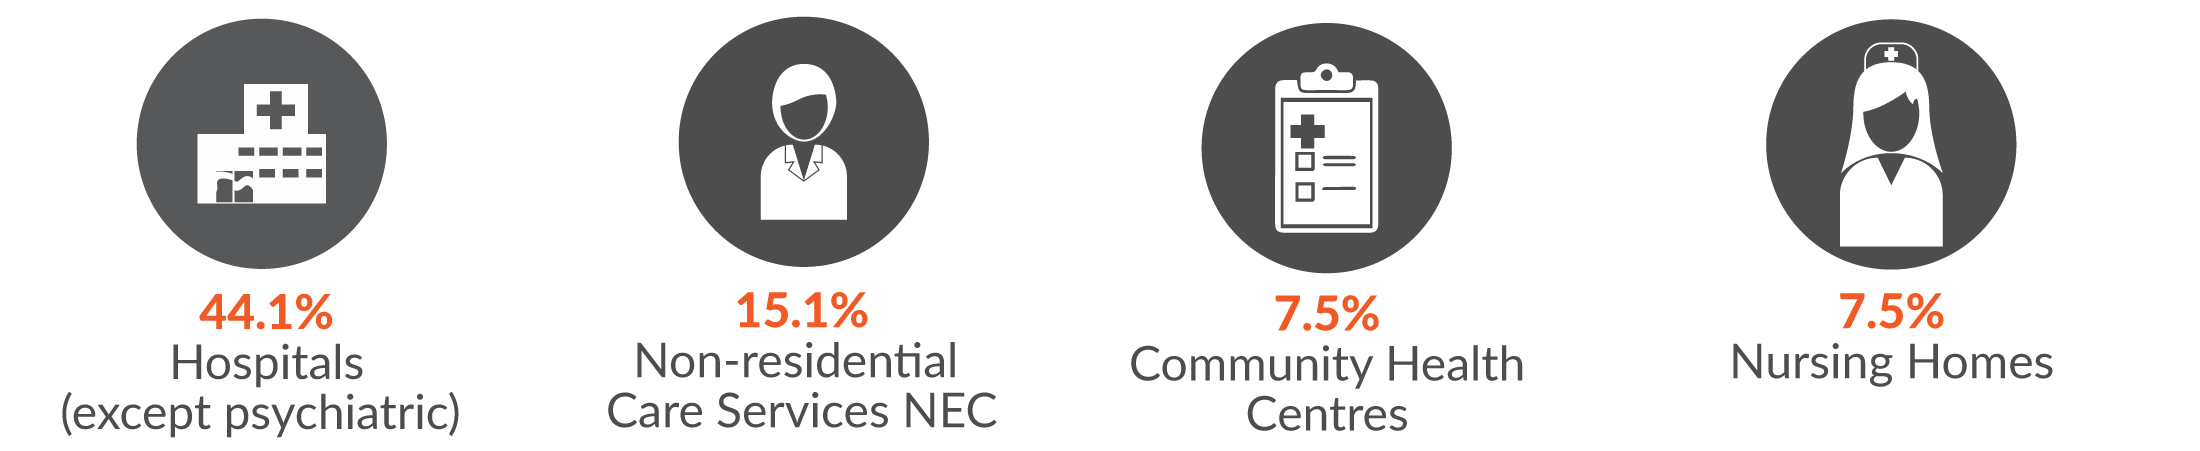
Main three industry sub-groups by serious injury
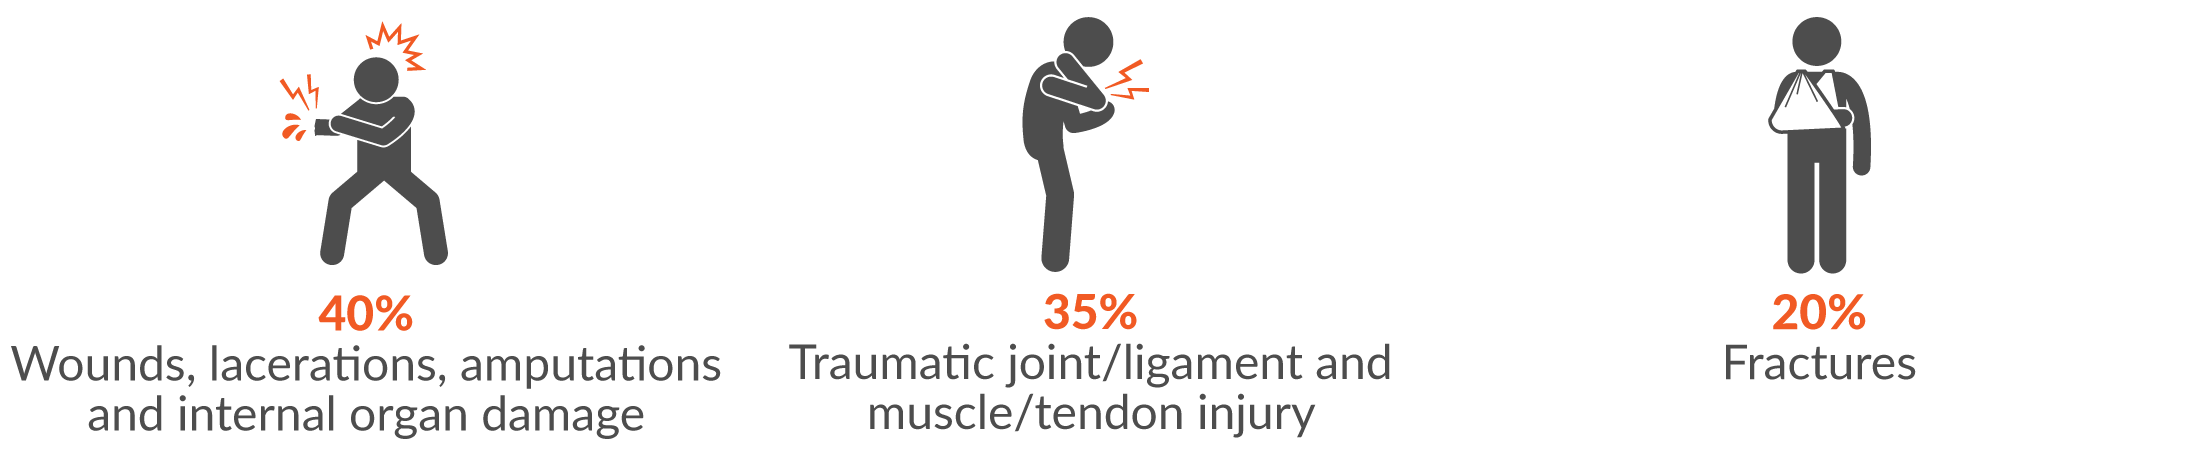
Main three mechanisms of serious injury
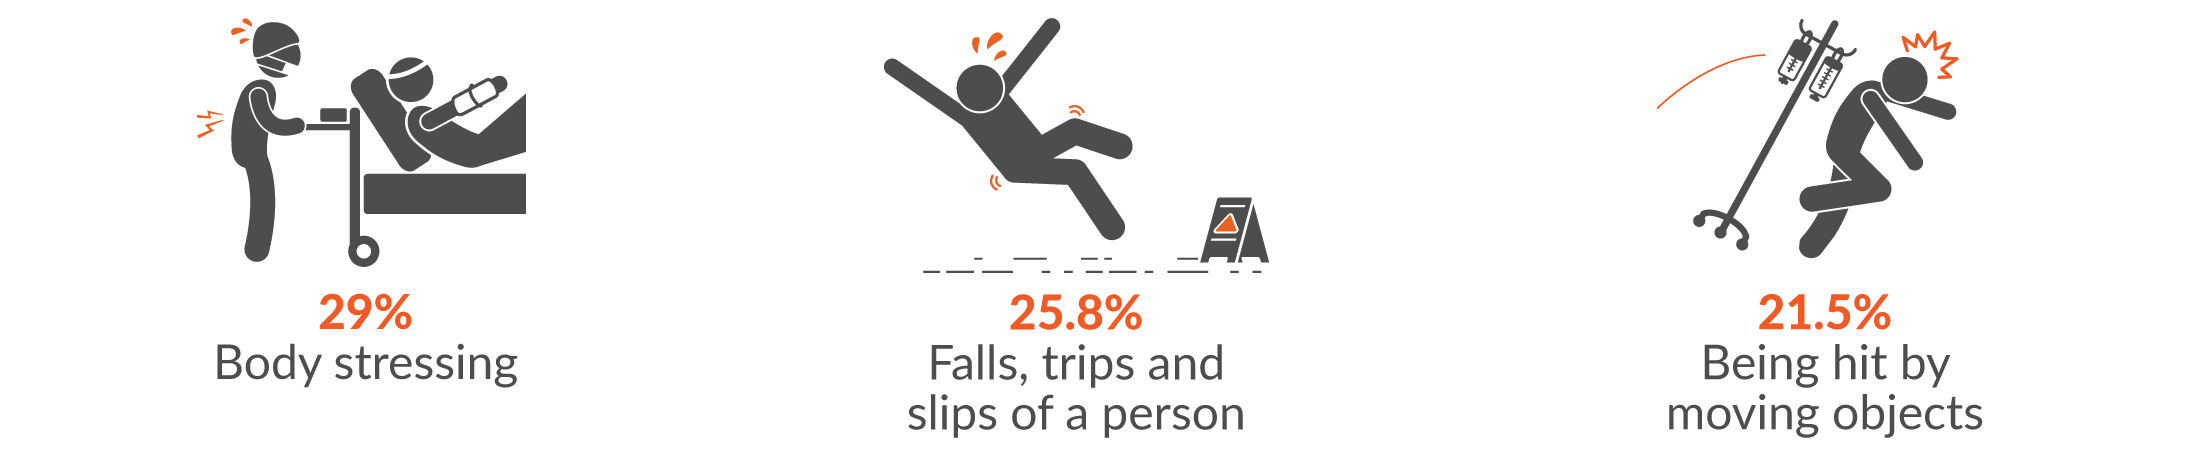
- Over 30% of all body stressing, and being hit by moving objects injury claims were for serious injuries.
- Almost 50% of all falls, trips and slips of a person injury claims were for serious injuries.
Break down by main mechanisms of serious injury
-
Body stressing
The main two injury groups resulting from body stressing were:
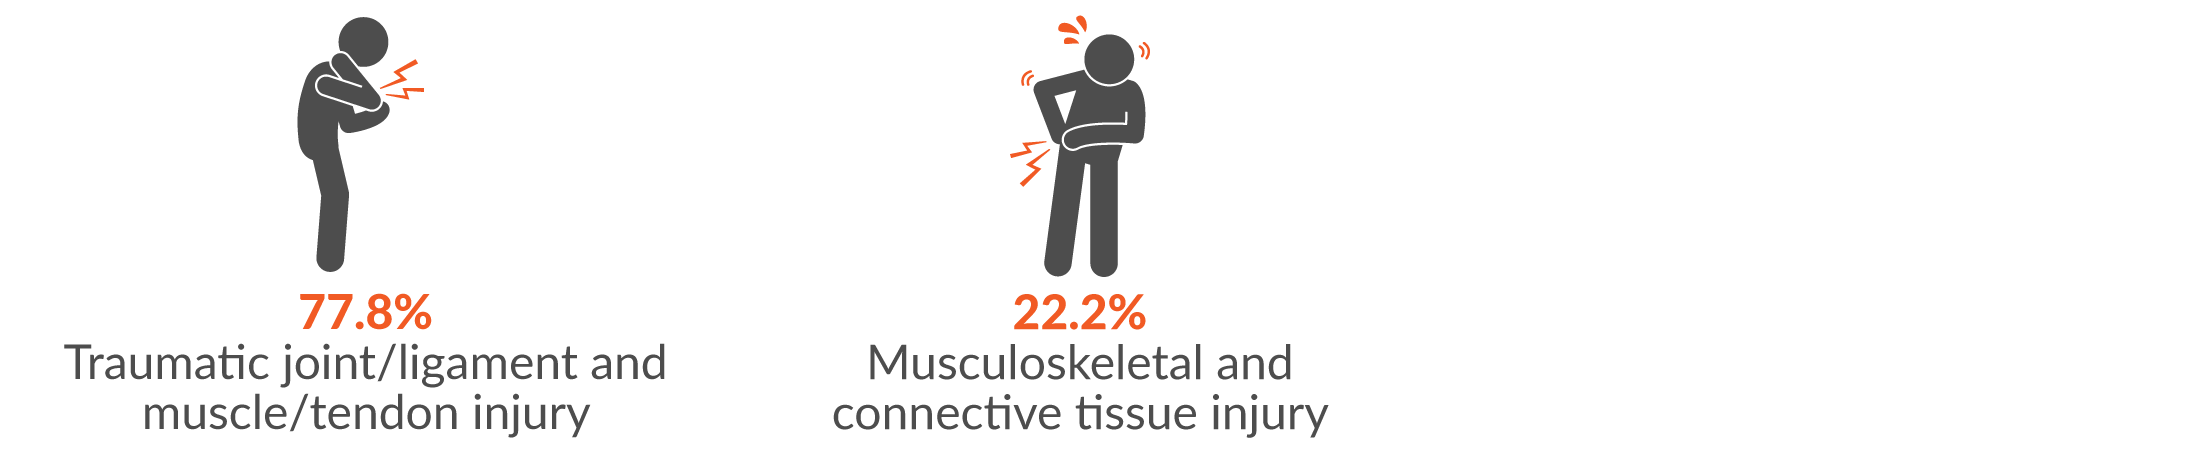
The two main incident types were:
- Muscular stress while handling objects other than lifting, carrying or putting down (44.4%)
- Muscular stress while lifting, carrying, or putting down objects (44.4%)
Main body areas injured were:
- Lower back (40.7%)
- Knee (11.1%)
-
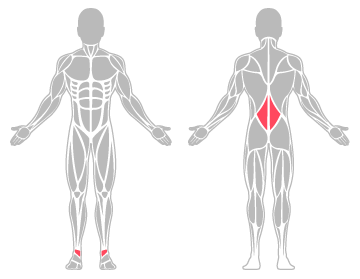
Falls, trips and slips of a person
The main three injury groups resulting from falls, trips and slips of a person were:
The main incident type was:
- Falls on the Same Level (91.7%)
Main body areas injured were:
- Ankle (25%)
- Lower back (12.5%)
-
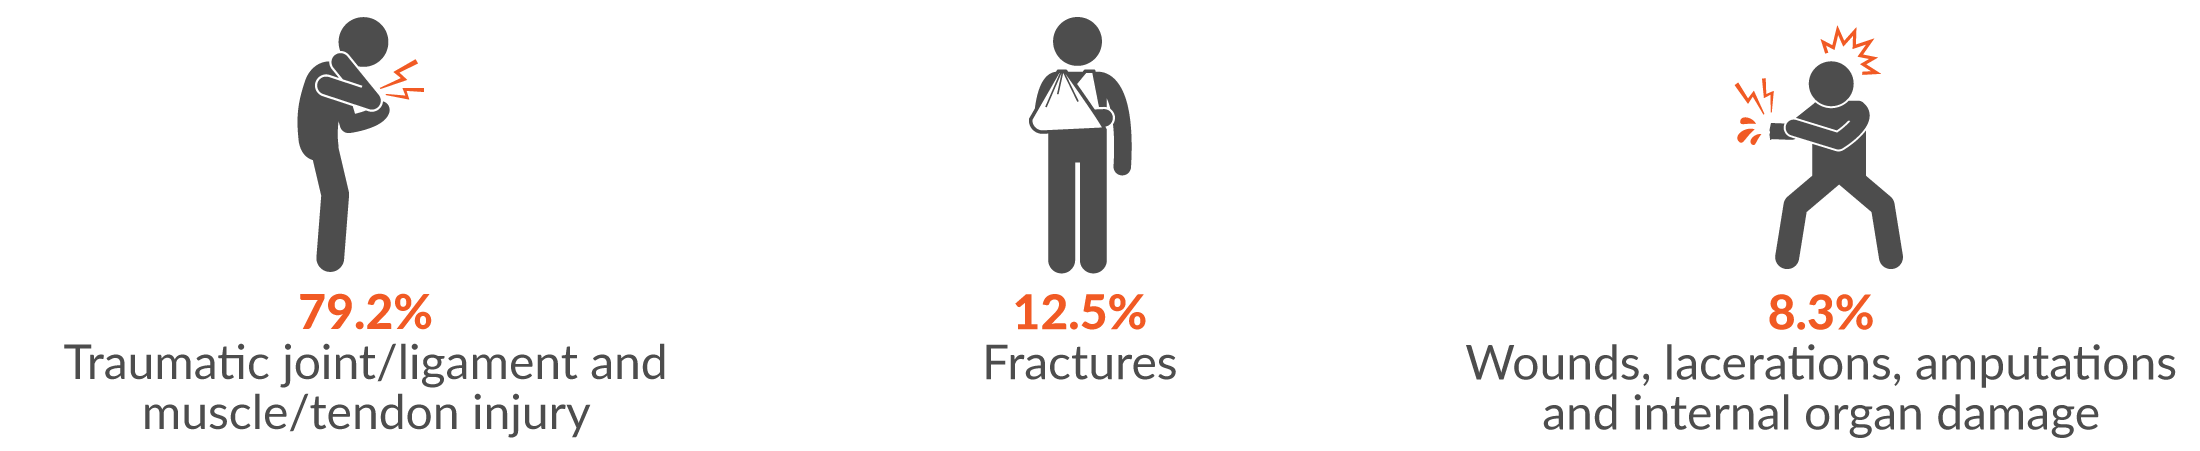
Being hit by moving object
The main two injury groups resulting from being it by moving objects were:
The three main incident types were:
- Being assaulted by a person or persons (45%)
- Being hit by falling objects (15%)
- Being bitten by an animal (also 15%)
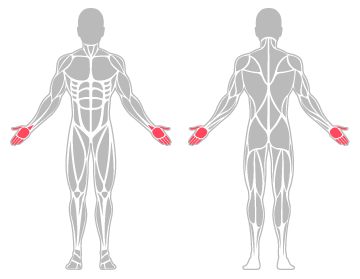
Main body areas injured were:
- Thumb (20%)
- Hand (10%)
- Wrist (10%)
- Fingers (10%)
Previously published infographics
The above information provides additional details to the Health and Community Services infographics published in October 2020. The serious injury specific infographics for Health and Community Services for 2019-20 is still available here (pdf 192.9 KB).