Key Work Health and Safety Statistics 2019-20*
Work-related fatalities under investigation

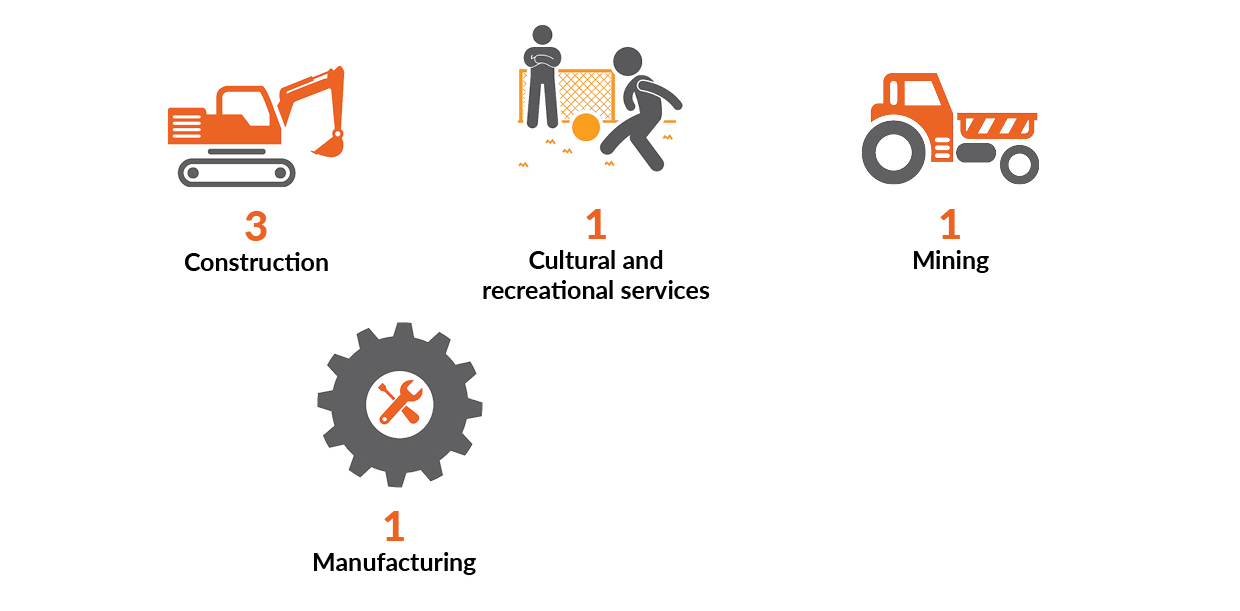
The six work-related fatalities that occurred in the 2019-20 financial year are currently under investigation.
Please note this figure only includes work-related fatalities investigated by NT WorkSafe. Some fatalities in the Northern Territory may fall in the jurisdiction of other national agencies.
Work-related fatalities by industry
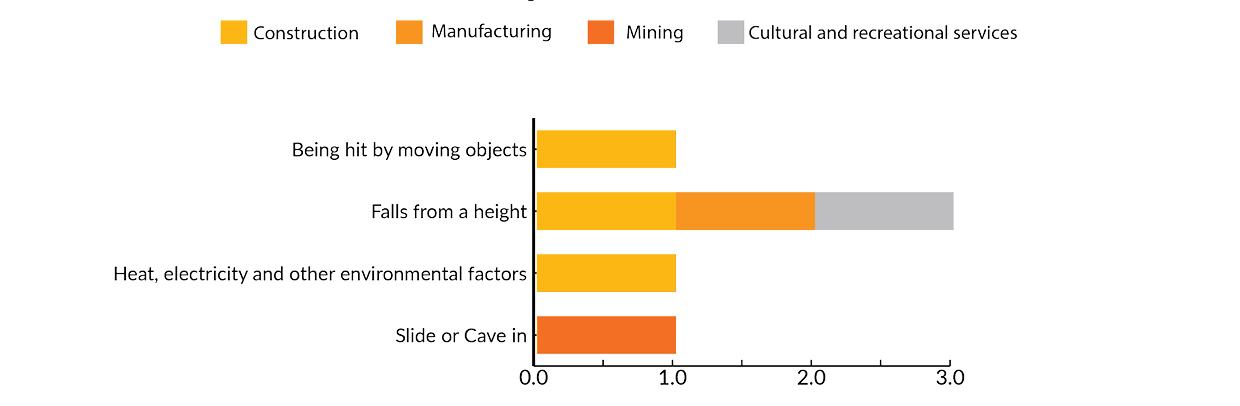
Work-related fatalities by mechanism of incident
Workers' compensation claims
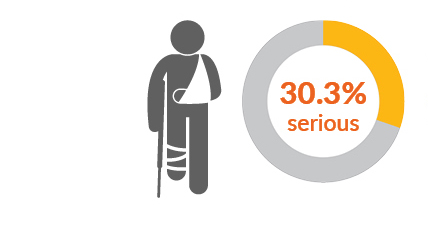
There were 1914 claims accepted in 2019-20 financial year, 580 or 30.3% of the claims were for serious injuries where the worker needed at least one week off due to their injuries.
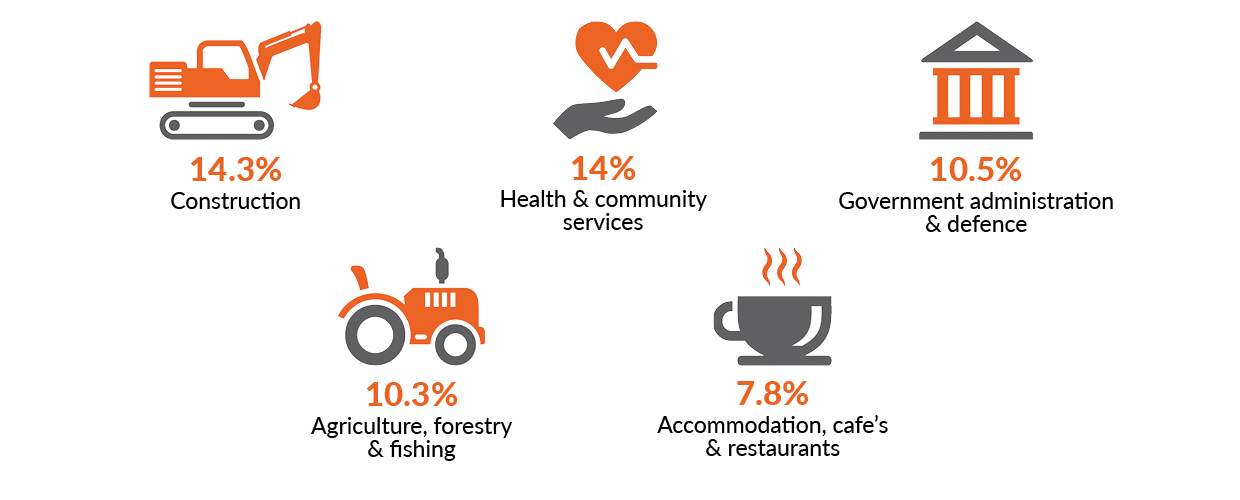
Industries with highest proportion of serious injury claims
Over half (56.9%) of the serious injury claims occurred in five industry sectors.
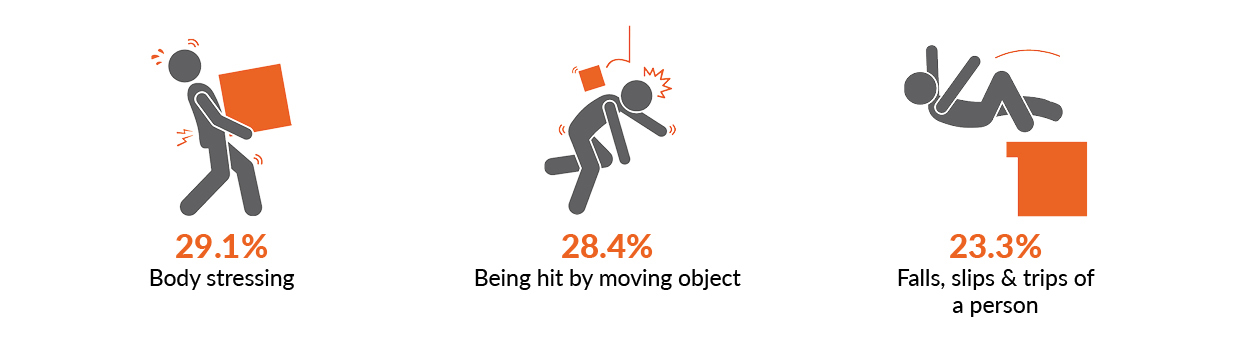
Main mechanism of injury for serious injury claims
Three mechanisms of injury caused 80.8% of the serious injuries.
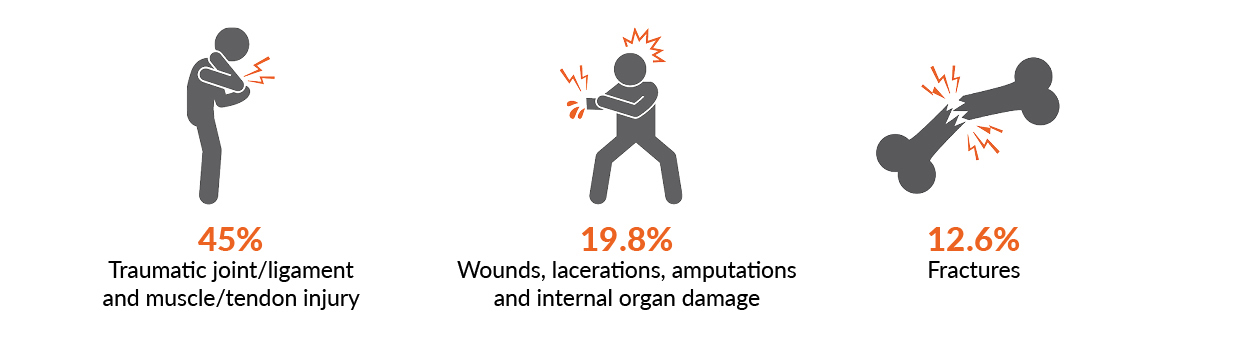
Main injury types for serious injury claims
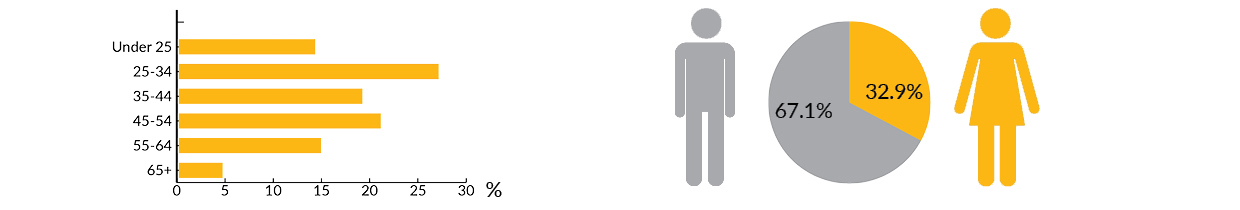
Serious injury claims - worker age and gender
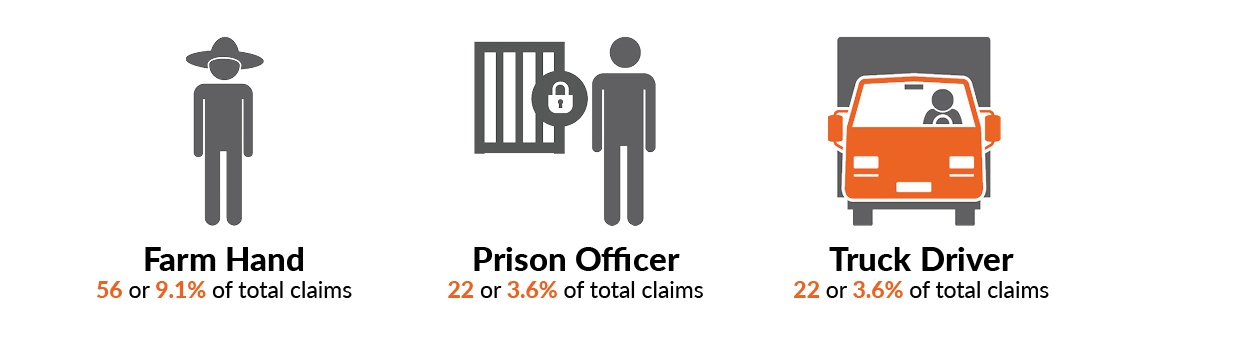
Worker occupations with the highest proportion of serious injury claims
Download related documents
- Key NT Work Health and Safety Statistics 2019-20*
- Work health and safety statistics 2019-20 - Construction industry
- Work health and safety statistics 2019-20 - Health and community services industry
- Work health and safety statistics 2019-20 - Government administration and defence industry
- Work health and safety statistics 2019-20 - Agriculture, forestry and fishing industry
- Work health and safety statistics 2019-20 - Accommodation, café and restaurants industry
Explanatory Notes
* Preliminary data subject to revision in subsequent years as claims are finalised.
- Statistics are based on data gathered from workers compensation claims.
- Australian and New Zealand Standard Industrial Classification (ANZSIC) 1993 used to identify industry sectors.
- Type of occurrence classification system (TOOCS) 3.1 used to identify mechanisms of injury.
- Australian Standard Classification of Occupations 2nd edition used to identify occupations.